Comparative Study
. 2007 Jun;80(6):1024-36.
doi: 10.1086/518313. Epub 2007 Apr 13.

A genomewide admixture map for Latino populations

Affiliations
Comparative Study

A genomewide admixture map for Latino populations

Alkes L Price et al. Am J Hum Genet. 2007 Jun.

Abstract

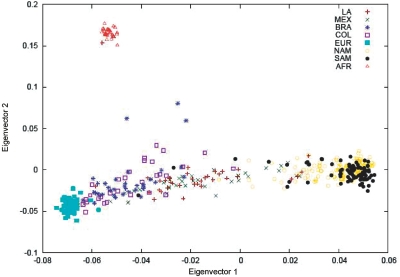
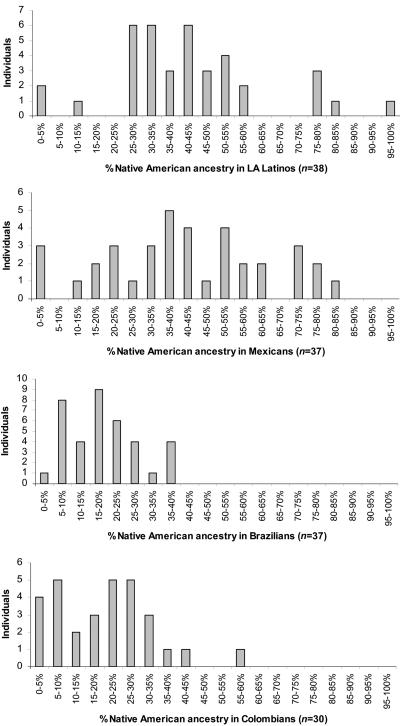
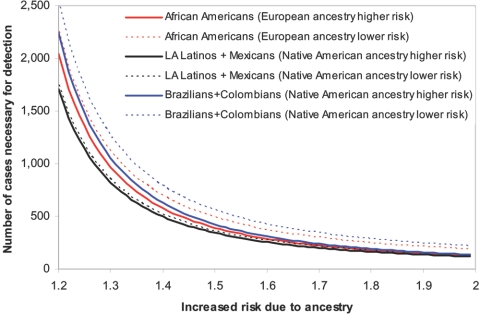
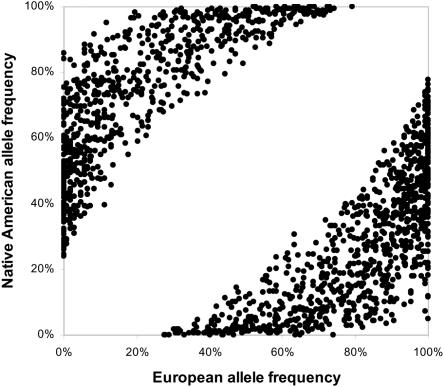
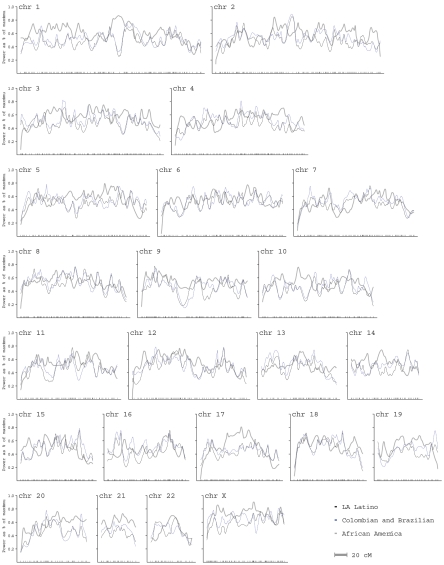
Admixture mapping is an economical and powerful approach for localizing disease genes in populations of recently mixed ancestry and has proven successful in African Americans. The method holds equal promise for Latinos, who typically inherit a mix of European, Native American, and African ancestry. However, admixture mapping in Latinos has not been practical because of the lack of a map of ancestry-informative markers validated in Native American and other populations. To address this, we screened multiple databases, containing millions of markers, to identify 4,186 markers that were putatively informative for determining the ancestry of chromosomal segments in Latino populations. We experimentally validated each of these markers in at least 232 new Latino, European, Native American, and African samples, and we selected a subset of 1,649 markers to form an admixture map. An advantage of our strategy is that we focused our map on markers distinguishing Native American from other ancestries and restricted it to markers with very similar frequencies in Europeans and Africans, which decreased the number of markers needed and minimized the possibility of false disease associations. We evaluated the effectiveness of our map for localizing disease genes in four Latino populations from both North and South America.


Figures

Figure  1.
Figure 1.
Top two axes of variation of Latinos, Europeans, Native Americans, and Africans. Coordinates along the top two axes of variation (eigenvectors) are dimensionless but roughly correspond to percentage of Native American ancestry for the first axis and percentage of African ancestry for the second axis. LA Latino (n=38), MEX=Mexican (n=37), BRA=Brazilian (n=37), COL=Colombian (n=30), EUR=European (n=57), NAM=Native North American (n=147), SAM=Native South American (n=95), and AFR=African (n=28).
Figure  2.
Figure 2.
Histogram of percentage of Native American ancestry in samples from four Latino populations
Figure  3.
Figure 3.
Number of samples needed to detect a disease locus with use of admixture mapping. For each population, this quantity is computed under the ideal assumption of perfect information about ancestry, as a function of the relative disease risk conferred by each copy of a particular ancestry at the disease locus. To convert from this to the actual number of samples required for detecting a disease locus with the map, it is necessary to multiply by 1/ravg; that is, the reciprocal of the information extraction at the locus (estimated in fig. 5).
Figure  4.
Figure  4.
European and Native American allele frequencies for the 1,649 markers in the final map, which are based on the results of validation genotyping.
Figure  5.
Figure 5.
Informativeness of the Latino admixture map as a percentage of the maximum, assessed empirically by the ravg statistic in LA Latinos (dark blue) and in Colombians and Brazilians (light blue). The X-axis gives genetic position, with each of 1,649 markers shown using hash marks. Informativeness of the map is slightly less at the edge of chromosomes, since we cannot use markers from both sides to infer ancestry. For comparison, in gray, we also show the power of our 1st-generation African American admixture map (1,166 markers used in a multiple sclerosis study6). chr=Chromosome.

References

Web Resources

    1. D.R. Lab Web site, http://genepath.med.harvard.edu/~reich/Software.htm (for ANCESTRYMAP and EIGENSOFT software)
    1. Latino admixture map, http://genepath.med.harvard.edu/~reich/Latinomap.htm (for the list of 1,649 markers)
    1. Online Mendelian Inheritance in Man (OMIM), http://www.ncbi.nlm.nih.gov/Omim/ (for prostate cancer, type 2 diabetes, obesity, gallbladder disease, rheumatoid arthritis, and asthma)

References

    1. Patterson N, Hattangadi N, Lane B, Lohmueller KE, Hafler DA, Oksenberg JR, Hauser SL, Smith MW, O’Brien SJ, Altshuler D, et al (2004) Methods for high-density admixture mapping of disease genes. Am J Hum Genet 74:979–1000 - PMC - PubMed
    1. Hoggart CJ, Shriver MD, Kittles RA, Clayton DG, McKeigue PM (2004) Design and analysis of admixture mapping studies. Am J Hum Genet 74:965–978 - PMC - PubMed
    1. Montana G, Pritchard JK (2004) Statistical tests for admixture mapping with case-control and cases-only data. Am J Hum Genet 75:771–789 - PMC - PubMed
    1. Smith MW, Patterson N, Lautenberger JA, Truelove AL, McDonald GJ, Waliszewska A, Kessing BD, Malasky MJ, Scafe C, Le E, et al (2004) A high-density admixture map for disease gene discovery in African Americans. Am J Hum Genet 74:1001–1013 - PMC - PubMed
    1. Zhu X, Luke A, Cooper RS, Quertermous T, Hanis C, Mosley T, Gu CC, Tang H, Rao DC, Risch N, et al (2005) Admixture mapping for hypertension loci with genome-scan markers. Nat Genet 37:177–18110.1038/ng1510 - DOI - PubMed

Publication types

Substances