. 2007 Jun;80(6):1076-89.
doi: 10.1086/518311. Epub 2007 Apr 24.

A mutation in CCDC50, a gene encoding an effector of epidermal growth factor-mediated cell signaling, causes progressive hearing loss

Affiliations

A mutation in CCDC50, a gene encoding an effector of epidermal growth factor-mediated cell signaling, causes progressive hearing loss

Silvia Modamio-Hoybjor et al. Am J Hum Genet. 2007 Jun.

Abstract

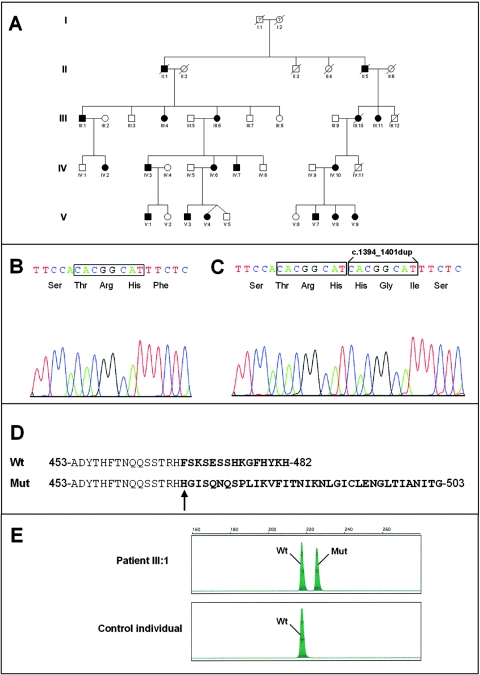
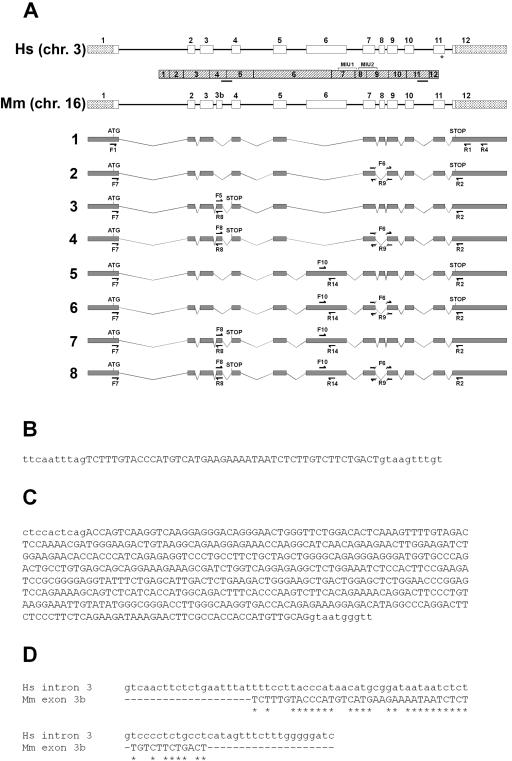
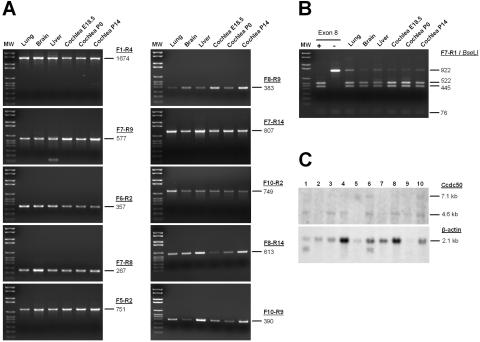
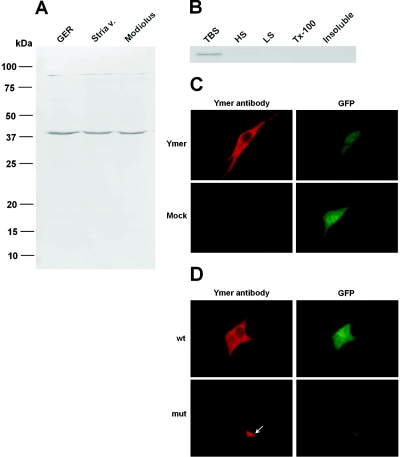
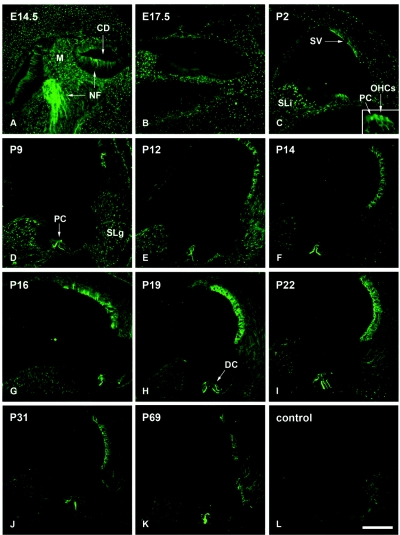
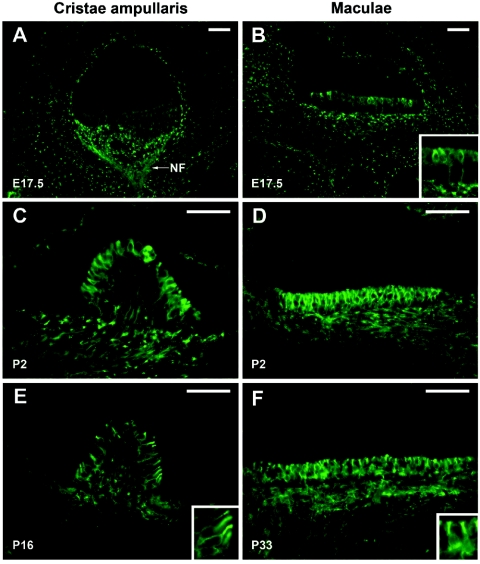
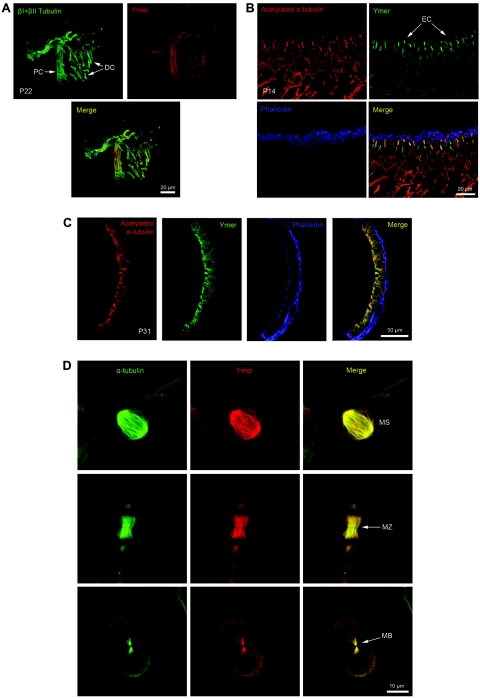
We previously mapped a novel autosomal dominant deafness locus, DFNA44, by studying a family with postlingual, progressive, nonsyndromic hearing loss. We report here on the identification of a mutation in CCDC50 as the cause of hearing loss in the family. CCDC50 encodes Ymer, an effector of epidermal growth factor (EGF)-mediated cell signaling that is ubiquitously expressed in different organs and has been suggested to inhibit down-regulation of the EGF receptor. We have examined its expression pattern in mouse inner ear. Western blotting and cell transfection results indicate that Ymer is a soluble, cytoplasmic protein, and immunostaining shows that Ymer is expressed in a complex spatiotemporal pattern during inner ear development. In adult inner ear, the expression of Ymer is restricted to the pillar cells of the cochlea, the stria vascularis, and the vestibular sensory epithelia, where it shows spatial overlap with the microtubule-based cytoskeleton. In dividing cells, Ymer colocalizes with microtubules of the mitotic apparatus. We suggest that DFNA44 hearing loss may result from a time-dependent disorganization of the microtubule-based cytoskeleton in the pillar cells and stria vascularis of the adult auditory system.


Figures

Figure  1.
Figure 1.
Mutation analysis of CCDC50. A, Pedigree of the family with DFNA44 hearing loss. Square symbols represent males; circles represent females. Black symbols represent hearing-impaired subjects; white symbols represent individuals with normal hearing. A question mark inside a symbol indicates that the clinical status of the subject is unknown. Individuals V:4 and V:5 are DZ twins. B and C, Fragment of CCDC50 exon 11 from patient III:1 showing the presence of two alleles, wild type and mutant, respectively, after being cloned separately into the pUC19 vector. The eight nucleotides that are duplicated in the mutant allele are boxed. D, Alignment of the C-terminal fragment of the deduced Ymer protein for both wild-type (wt) and mutant (mut) alleles. Arrow points to the site where the frameshift takes place, and amino acids that are different in the two alleles are shown in bold. E, Diagnostic test for the c.1394_1401dupCACGGCAT mutation, based on the separation of wild-type and mutant alleles with the use of an automated genetic analyzer.
Figure  2.
Figure 2.
Analysis of Ccdc50 transcripts in the mouse inner ear. A, Schematic drawing of human (Hs) and mouse (Mm) Ccdc50 genomic organization. Exons are represented by rectangles. The ORF is depicted in white, and the UTRs are dotted. The asterisk marks the site where the mutation was found in the family with DFNA44 hearing loss. A diagram of the Ymer protein (striped) includes the position of the two MIU domains and the peptides in the N- and C-terminal regions (gray bars) used for generating the polyclonal antibody. Below, the eight Ccdc50 transcript variants detected in mouse inner ear cDNA are shown. Primers used to amplify each variant are represented by arrows (see the “Materials and Methods” section). Primers F6 and R9 were designed to anneal with exons 7 and 9 (only the three most 3′ bases of each one are capable of annealing with exon 9 or 7, respectively), and thus they were used to amplify transcripts without exon 8. Primers F5, F8, and R8 were designed to anneal with exon 3b, and they were used to amplify transcripts that contain this exon. Primers F10 and R14 are specific to exon 6. B and C, Sequences of mouse Ccdc50 exon 3b and exon 6, respectively. Intronic sequences are in lowercase letters. D, ClustalW alignment between human (Hs) CCDC50 intron 3 and mouse (Mm) Ccdc50 exon 3b.
Figure  3.
Figure 3.
A, Panels showing the different RT-PCR amplification products of the overlapping fragments used to identify the different transcripts. Primer pairs and expected fragment sizes (in bp) are shown on the right. The first panel (F1-R4) represents the primary PCR, from which the remaining ones were obtained as nested PCRs. Each amplimer was confirmed by direct sequencing. B, Restriction pattern of the F7-R1 amplimer (nested PCR from F1-R4 containing the entire Ccdc50 ORF) digested with BseLI, showing the presence of transcripts 1 and 2. Restriction pattern of transcript 1 (with exon 8) includes three bands of 522 bp, 445 bp, and 76 bp. Transcript 2 (without exon 8) digestion yields two bands of 922 bp and 76 bp. Exon 8 positive and negative controls were obtained by amplifying cloned transcripts 1 and 2, respectively (see the “Material and Methods” section). C, Northern blot showing the expression pattern of Ccdc50 in different mouse tissues. A probe against β-actin was used as a positive control. Lanes: 1, heart; 2, brain; 3, liver; 4, spleen; 5, kidney; 6, embryo; 7, lung; 8, thymus; 9, testes; and 10, ovary. MW = molecular-weight marker.
Figure  4.
Figure 4.
Western blot analysis and subcellular localization of the Ymer protein. A, Western blots of tissue samples from the GER, stria vascularis (stria v.), and modiolus of the mouse cochlea. A prominent band of ∼38 kDa was revealed in the three tissues tested. A minor higher-mass band of ∼88 kDa is also revealed and may correspond to a nonreducible dimeric form of the protein. B, Western blot performed on proteins prepared by sequentially extracting whole cochlear tissue in TBS, 1 M NaCl (high salt [HS]), 10 mM Tris (low salt [LS]), and 1% Triton X-100 (Tx-100). The residual remaining protein is the insoluble fraction. Ymer is detected only in the TBS soluble fraction. C, Subcellular localization of mouse Ymer protein in transiently transfected NIH-3T3 cells. Cells transfected with the mouse Ccdc50 transcript 1 show a cytoplasmic distribution of Ymer protein (red) that is absent from the nucleus (top left). Similar results were obtained in Hela cells or when both types of cells were transfected with transcript 2 (data not shown). No staining was obtained in cells transfected with the empty vector (mock [bottom left]). The transfection level was visualized by GFP expression (right, top and bottom). D, NIH-3T3 cells transfected with the human mutated transcript 1 showed an aggregated perinuclear distribution of the protein (arrow). Similar results were obtained in cells transfected with the mutated human transcript 2.
Figure  5.
Figure 5.
Spatiotemporal expression pattern of Ymer protein in the mouse cochlea. Immunohistochemistry was performed on mouse inner ear sections at embryonic stages E14.5 and E17.5 and several postnatal stages from P2 to P69. Inset in panel C shows a magnification of the apical region of developing PCs and the OHCs. Panel L shows a negative control performed on a P69 section with the use of nonimmune rabbit IgG. Similar results were obtained when we used preimmune sera from the rabbit used to generate the polyclonal antibody. M = mesenchyme; CD = cochlear duct; NF = nerve fibers; SLi = spiral limbus; SV = stria vascularis; SLg = spiral ligament; DC = Deiter’s cells. Scale bar = 100 μm.
Figure  6.
Figure 6.
Spatiotemporal expression pattern of Ymer protein in the mouse vestibular system. Ymer staining was investigated on vestibular sections from embryonic (A and B, E17.5), neonatal (C and D, P2) and adult (E, P16 and F, P33) stages. Panels A, C, and E show cristae ampullaris; panels B, D, and F show maculae (B and F, utricles; D, saccule). Insets in panels B, E, and F show magnifications of the corresponding sensory epithelia. NF = nerve fibers. Scale bars = 50 μm.
Figure  7.
Figure 7.
Colocalization studies of Ymer and different tubulins in inner ear sections and NIH-3T3 cells. A, In the mature cochlea (P22), Ymer colocalizes with (β1+β2) tubulin in the cytoskeleton of PCs and Deiter’s cells (DC). Similar results were obtained for α-tubulin and for both acetylated and polyglutamylated tubulin (data not shown). B, In the utricule of a P14 mouse, Ymer shows spatial overlap with the cytoskeleton of microtubules in the apical cytoplasm of the epithelial cells (EC). C, In adult stria vascularis (P31), Ymer colocalizes with the microtubule-based cytoskeleton of marginal and intermediate cells. In panels B and C, no colocalization is seen with the actin cytoskeleton (phalloidin panel). D, Ymer colocalizes with microtubules of the mitotic apparatus in nontransfected NIH-3T3 cells that are undergoing cell division. In metaphase (top panels), Ymer distribution overlaps with microtubules of the mitotic spindle (MS). During early telophase (middle panels), Ymer colocalizes with the midzone (MZ), a region of bundled microtubules between the migrated chromosomes. In late telophase (lower panels), as the cleavage furrow ingresses compressing the midzone, Ymer colocalizes with the microtubule midbody (MB) contained in the intercellular bridge.

References

Web Resources

    1. BLAST, http://www.ncbi.nlm.nih.gov/BLAST/
    1. ClustalW, http://www.ebi.ac.uk/clustalw
    1. dbSNP, http://www.ncbi.nlm.nih.gov/SNP/
    1. GenBank, http://www.ncbi.nlm.nih.gov/GenBank/ (for CCDC50 transcripts 1 [accession number NM_174908] and 2 [accession number NM_178335], Ccdc50 transcripts 1 [accession number NM_026202.2] and 2 [accession number NM_001025615.1]), mouse organ of Corti [accession number BQ567072.1] and adult mouse testis [accession number AK016827.1] Ccdc50 ESTs, and Ccdc50 pseudogene [accession number NG_005190.2])
    1. Hereditary Hearing Loss Homepage, http://webhost.ua.ac.be/hhh/

References

    1. Petersen MB (2002) Non-syndromic autosomal-dominant deafness. Clin Genet 62:1–1310.1034/j.1399-0004.2002.620101.x - DOI - PubMed
    1. Friedman TB, Griffith AJ (2003) Human nonsyndromic sensorineural deafness. Annu Rev Genomics Hum Genet 4:341–41210.1146/annurev.genom.4.070802.110347 - DOI - PubMed
    1. Petersen MB, Willems PJ (2006) Non-syndromic, autosomal-recessive deafness. Clin Genet 69:371–39210.1111/j.1399-0004.2006.00613.x - DOI - PubMed
    1. Modamio-Høybjør S, Moreno-Pelayo MA, Mencia A, del Castillo I, Chardenoux S, Morais D, Lathrop M, Petit C, Moreno F (2003) A novel locus for autosomal dominant nonsyndromic hearing loss (DFNA44) maps to chromosome 3q28–29. Hum Genet 112:24–2810.1007/s00439-002-0836-x - DOI - PubMed
    1. Vazza G, Picelli S, Bozzato A, Mostacciuolo ML (2003) Identification and characterization of C3orf6, a new conserved human gene mapping to chromosome 3q28. Gene 314:113–12010.1016/S0378-1119(03)00710-8 - DOI - PubMed

Publication types

MeSH terms

Substances