. 2007 Jun;5(6):e143.
doi: 10.1371/journal.pbio.0050143.

A K ATP channel-dependent pathway within alpha cells regulates glucagon release from both rodent and human islets of Langerhans

Affiliations

A K ATP channel-dependent pathway within alpha cells regulates glucagon release from both rodent and human islets of Langerhans

Patrick E MacDonald et al. PLoS Biol. 2007 Jun.

Abstract

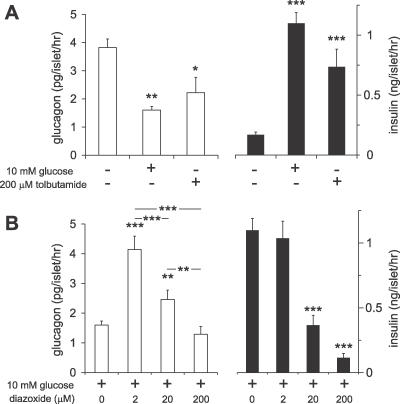
Glucagon, secreted from pancreatic islet alpha cells, stimulates gluconeogenesis and liver glycogen breakdown. The mechanism regulating glucagon release is debated, and variously attributed to neuronal control, paracrine control by neighbouring beta cells, or to an intrinsic glucose sensing by the alpha cells themselves. We examined hormone secretion and Ca(2+) responses of alpha and beta cells within intact rodent and human islets. Glucose-dependent suppression of glucagon release persisted when paracrine GABA or Zn(2+) signalling was blocked, but was reversed by low concentrations (1-20 muM) of the ATP-sensitive K(+) (KATP) channel opener diazoxide, which had no effect on insulin release or beta cell responses. This effect was prevented by the KATP channel blocker tolbutamide (100 muM). Higher diazoxide concentrations (>/=30 muM) decreased glucagon and insulin secretion, and alpha- and beta-cell Ca(2+) responses, in parallel. In the absence of glucose, tolbutamide at low concentrations (<1 muM) stimulated glucagon secretion, whereas high concentrations (>10 muM) were inhibitory. In the presence of a maximally inhibitory concentration of tolbutamide (0.5 mM), glucose had no additional suppressive effect. Downstream of the KATP channel, inhibition of voltage-gated Na(+) (TTX) and N-type Ca(2+) channels (omega-conotoxin), but not L-type Ca(2+) channels (nifedipine), prevented glucagon secretion. Both the N-type Ca(2+) channels and alpha-cell exocytosis were inactivated at depolarised membrane potentials. Rodent and human glucagon secretion is regulated by an alpha-cell KATP channel-dependent mechanism. We propose that elevated glucose reduces electrical activity and exocytosis via depolarisation-induced inactivation of ion channels involved in action potential firing and secretion.


Conflict of interest statement

Competing interests. The authors have declared that no competing interests exist.

Figures

Figure 1
Figure 1. Glucose Suppresses Glucagon Release Independently of Paracrine Signals Mediated by Zn2+ or GABA.
(A) Glucagon release from isolated mouse islets was suppressed by 60% at 7 mM glucose compared with 1 mM (filled bars). Glucose retained its suppressive effect on glucagon release under conditions of Zn2+ chelation (Ca2+-EDTA) (open bars) and antagonism of GABAA receptors (SR-95531) (shaded bars). Antagonism of GABAA receptors increased both basal and glucose-suppressed glucagon secretion, suggesting a paracrine role for GABA independent of the glucose effect. (B) As in (A), but using rat islets. *, p < 0.05; **, p < 0.01; ***, p < 0.001, compared with 1 mM glucose, or as indicated.
Figure 2
Figure 2. Glucagon Release from Isolated and Intact Mouse Islets Is Regulated by a KATP Channel-Dependent Pathway
(A) Glucagon (filled circles) and insulin (open circles) secretion measured from mouse islets in the presence of 8.3 mM glucose at increasing concentrations of diazoxide. (B) As in (A), but using rat islets. The glucagon responses to 1 mM glucose (filled square) and 100 μM tolbutamide (filled triangle) are indicated. (C) As in (A), but in the presence of 1 mM glucose and only measuring glucagon secretion. (D) As in (A), but examining the effect of tolbutamide in the absence of glucose. Glucagon secretion in response to 20 mM glucose is indicated by the filled square. *, p < 0.05; **, p < 0.01; ***, p < 0.001, compared with zero diazoxide (A–C) or zero tolbutamide (D).
Figure 3
Figure 3. Tolbutamide and Glucose Effects Are Non-Additive and Glucagon Response Is Altered in Kir6.2Y12X Islets That Express a Truncated Kir6.2 Subunit
(A) Glucagon release from isolated mouse islets at 1 (open bars) and 20 mM glucose (filled bars) under control conditions and presence of 0.5 mM tolbutamide. (B) A glucose dose-response of glucagon release from control C3HB islets (filled circles) and Kir6.2Y12X islets (open circles). (C) As in (B), but insulin was measured. *, p < 0.05; **, p < 0.01; ***, p < 0.001, compared with control.
Figure 4
Figure 4. The Intracellular Ca2+ Response of Single α Cells within Intact Islets Can Be Re-Activated by Low Concentrations of Diazoxide
(A) Representative intracellular Ca2+ responses from α and β cells within an intact mouse islet exposed to 0.5 mM glucose, 11 mM glucose, and 11 mM glucose plus 2 μM diazoxide (diaz) as indicated above the traces. (B) The Ca2+ response of α cells was suppressed by 11 mM glucose, and could be reactivated with low concentrations of the KATP channel agonist diazoxide. ***, p < 0.001, compared with the low-glucose condition, or as indicated.
Figure 5
Figure 5. Glucagon Release from Isolated and Intact Human Islets Is Regulated by a KATP Channel-Dependent Pathway
(A) Glucagon (open bars) and insulin (filled bars) release was measured from isolated human islets under control conditions and following addition of 10 mM glucose or 200 μM tolbutamide. (B) Glucagon (open bars) and insulin secretion (filled bars) measured in the presence of 10 mM glucose and increasing concentrations of diazoxide (0–200 μM). *, p < 0.05; **, p < 0.01; ***, p < 0.001, compared with controls, unless otherwise indicated.
Figure 6
Figure 6. Intracellular Ca2+ Responses of α Cells within Intact Human Islets Are Regulated by a KATP Channel-Dependent Mechanism
(A) Ca2+ responses measured in two human α cells within the same islet at 0.5 mM and 11 mM glucose (glu), in the presence of 2 μM diazoxide (diaz). (B) Summary of the Ca2+ responses at 0.5 mM glucose, at 11 mM glucose, in the presence of glucose (11 mM) and diazoxide (2 μM), and following the removal of diazoxide, but in the continued presence of 11 mM glucose. (C) The re-activation of human α-cell Ca2+ responses by 2 μM diazoxide was reversed upon application of the KATP channel antagonist tolbutamide (100 μM). (D) The effects of increasing concentrations of diazoxide on the Ca2+ response of a human α cell and β cell within the same islet exposed to 11 mM glucose. At the end of the experiment, diazoxide was withdrawn and glucose lowered to 0.5 mM. (E) Dose-response curve for the effect of diazoxide on α-cell Ca2+ responses. The grey horizontal line indicates the response with 11 mM glucose alone. *, p < 0.05; **, p < 0.01; ***, p < 0.001, compared with controls, unless otherwise indicated.
Figure 7
Figure 7. Glucagon Secretion and α-Cell Ca2+ Responses Are Dependent upon the Activity of Voltage-Dependent Na+ Channels
(A) Glucagon (open bars) and insulin (filled bars) release from isolated mouse islets at 1 mM and 20 mM glucose, under control conditions and in the presence of the Na+ channel antagonist TTX (0.1 μg/ml). (B) Intracellular Ca2+ response of single α cells to 0.5 mM glucose. TTX (0.1 μg/ml) was included in the perfusion medium during the indicated period. (C) The effects of TTX and glucose on α-cell Ca2+ responses. Note that TTX inhibits Ca2+ responses as effectively as glucose and that the action is at least partially reversible. *, p < 0.05; **, p < 0.01; ***, p < 0.001, compared with controls, unless otherwise indicated.
Figure 8
Figure 8. Glucagon Secretion Is Regulated by N-Type Ca2+ Channels
(A) Glucagon release measured at 1 (open bars) and 20 mM glucose (filled bars) under control conditions and in the presence of 100 nM ω-conotoxin (middle) or 20 μM nifedipine (right). (B) Exocytosis was elicited by 500-ms depolarisations from −70 to 0 mV under control conditions (Ctrl) and in the presence of either nifedipine (50 μM; nif) or ω-conotoxin (1 μM; ω-con). (C) Summary of the exocytotic response under control conditions and in the presence of nifedipine and ω-conotoxin. *, p < 0.05; **, p < 0.01, compared with 1 mM glucose and the control capacitance response, unless indicated otherwise.
Figure 9
Figure 9. Voltage-Dependent Inactivation of α-Cell N-Type Ca2+ Currents and Exocytosis
(A) N-type Ca2+ currents were evaluated during blockade of the L-type channels with isradipine (2 μM). The N-type channel antagonist ω-conotoxin (1 μM; red traces) reduced the Ca2+ current elicited by a step depolarisation from −70 to 0 mV (right). (B) As in (A), but the pulse to 0 mV was preceded by a 200-ms conditioning depolarization to +10 mV. ω-Conotoxin was without effect on the current measured during the depolarization to 0 mV under these conditions (right). (C) Top: peak Ca2+ currents measured in the presence of 2 μM isradipine alone (open squares) or together with 1 μM ω-conotoxin (red circles) during a depolarization to 0 mV following 200-ms conditioning pulses to between −70 and +70 mV. Lower: inactivation of the ω-conotoxin–sensitive component. Half-maximal inactivation of the N-type current was at −31 ± 6 mV (n = 5). (D) Exocytosis was elicited with 500-ms depolarisations from −70 mV to between −50 and 20 mV. (E) The voltage dependence of the exocytotic response. (F) Exocytosis elicited by 500-ms depolarisations to 0 mV from holding potentials of between −70 and −30 mV. (G) Summary of effects of holding potential on exocytotic responses elicited by depolarisations to 0 mV. Data have been normalized to responses obtained using a holding potential of −70 mV. *, p < 0.05; **, p < 0.01; ***, p < 0.001, compared with ω-conotoxin (C, top) or with the initial response.
Figure 10
Figure 10. A Model for the Suppression of Glucagon Secretion by an Intrinsic α-Cell Pathway
Schematic representation of the effects of glucose, tolbutamide, and diazoxide on α-cell KATP, Na+, and N-type Ca2+ (VDCC) channel activities and glucagon secretion is shown. The insulin response is also shown for comparison with our experimental results (dashed lines, lower panels). The grey gradient represents a “window” of α-cell KATP channel activity that supports the activation of Ca2+ and Na+ channels. Above this window, the cell is hyperpolarized and Ca2+ and Na+ channel activation is prevented, whereas KATP channel activity below this window depolarizes the cell and causes voltage-dependent inactivation of Ca2+ and Na+ channels. (A) High-glucose concentration reduces α-cell KATP channel activity, reducing glucagon secretion. (B) Graded application of tolbutamide (in zero glucose) transiently increases glucagon secretion as KATP channel activity is reduced through, and eventually below, the window supporting glucagon release. (C) The graded application of diazoxide in high-glucose conditions increases α-cell KATP channel activity into, and then above the window supporting glucagon secretion. The result is a transient “re-activation” of glucagon secretion at low-diazoxide concentrations. (D) In low-glucose (1–2 mM) conditions, graded application of diazoxide increases KATP channel activity above the window supporting glucagon secretion, causing a monotonic inhibition of glucagon release.

Similar articles

Cited by

References

    1. MacDonald PE, Joseph JW, Rorsman P. Glucose-sensing mechanisms in pancreatic β-cells. Philos Trans R Soc Lond B Biol Sci. 2005;360:2211–2225. - PMC - PubMed
    1. Shah P, Basu A, Basu R, Rizza R. Impact of lack of suppression of glucagon on glucose tolerance in humans. Am J Physiol. 1999;277:E283–E290. - PubMed
    1. Cryer PE. Hypoglycaemia: The limiting factor in the glycaemic management of Type I and Type II diabetes. Diabetologia. 2002;45:937–948. - PubMed
    1. Cryer PE. Diverse causes of hypoglycemia-associated autonomic failure in diabetes. N Engl J Med. 2004;350:2272–2279. - PubMed
    1. Gromada J, Franklin I, Wollheim CB. α-Cells of the endocrine pancreas: 35 years of research but the enigma remains. Endocr Rev. 2007;28:84–116. - PubMed

Publication types