

doi: 10.1186/gb-2007-8-5-r83.
A distance difference matrix approach to identifying transcription factors that regulate differential gene expression
Affiliations
- PMID: 17504544
- PMCID: PMC1929144
- DOI: 10.1186/gb-2007-8-5-r83
Item in Clipboard
A distance difference matrix approach to identifying transcription factors that regulate differential gene expression
Genome Biol.
2007.
Abstract
We introduce a method that considers target genes of a transcription factor, and searches for transcription factor binding sites (TFBSs) of secondary factors responsible for differential responses among these targets. Based on the distance difference matrix concept, the method simultaneously integrates statistical overrepresentation and co-occurrence of TFBSs. Our approach is validated on datasets of differentially regulated human genes and is shown to be highly effective in detecting TFBSs responsible for the observed differential gene expression.
Figures

Principle of the DDM-MDS approach. A color code is consistently used in this Figure to indicate the status of the TFBSs predicted by a PWM. In the first set of promoters a CRM of three TFBSs is present (reddish), whereas the second set of promoters contains a CRM of two TFBSs (greenish). TFBSs not relevant for the differential expression between the genes corresponding to the two promoter sets are indicated in gray. (a) Two matrices, each of which contains the numbers of predicted TFBSs per PWM and per promoter (counts) for one set of promoters of differentially regulated genes. These counts are obtained by scanning the promoters with a precompiled library of PWMs. The number of promoters in both sets is the same in this artificial example, but does not need to be (see normalization in Materials and methods). Two PWMs are considered associated on the TFBS level if their corresponding columns (PWM-vectors) in the matrix are similar. This similarity can be measured using a distance function. (b) Distance matrices summarizing all PWM associations are constructed in both sets of promoters. (c) Subtraction of those distance matrices gives the DDM. PWMs predicting TFBSs in both promoter sets to the same amount (false positives as well as true positives: gray) and hence not involved in differential expression will show low DD values among each other. The DD values among the PWMs with associated and overrepresented TFBS predictions (greenish and reddish) will be just as low, but the DD values between those PWMs and the non-involved ones will be much higher (c). By performing MDS on the DDM, we can map the PWMs onto two-dimensional space and distinguish PWMs whose TFBSs are not contributing to the observed differential gene expression, as they will be mapped on the origin, from 'deviating' PWMs whose TFBSs are likely responsible for the observed differential gene expression. (d) The DDM-MDS plot clusters PWMs whose predicted TFBSs are strongly associated closer together than PWMs with less associated predicted TFBSs.
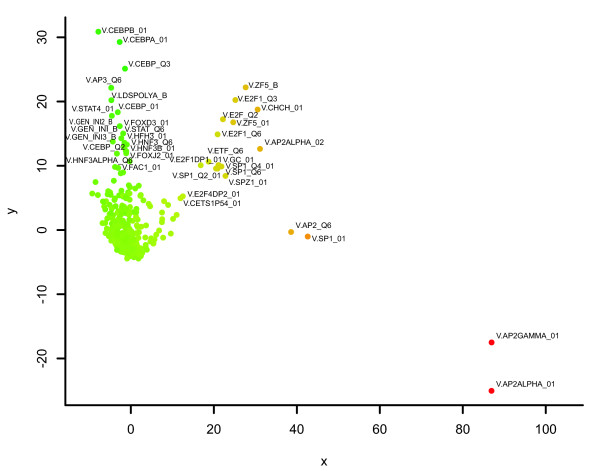
DDM-MDS plot of the TFBS associations found in the E2F dataset. Every dot corresponds to a specific PWM from the TRANSFAC 8.4 Professional Motif library. The parameters for Match were set to 0.9 for core similarity and 0.75 for matrix similarity. Most of the PWMs were mapped around the origin, indicating that they are either common to either dataset or that they participate in random TFBS associations. The color of the dot indicates whether the TFBS participates more in associations found in promoters of up-regulated genes (red) or down-regulated genes (green). Associated with up-regulation (red), we find binding sites for E2F, ZF5, AP-2alpha and AP-2gamma. Associated with down-regulation, we find binding sites for several CEBPs, STATs and HNFs.
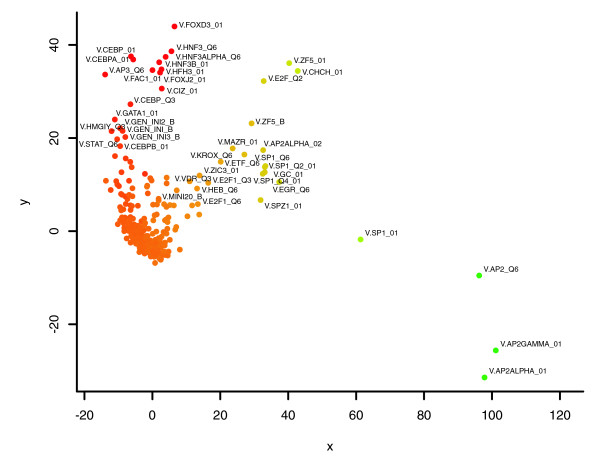
DDM-MDS plot of the TFBS associations found in the p53 dataset. Associated with up-regulation we find binding sites for several CEBPs, STATs and HNFs. Associated with down-regulation we observe binding sites for E2F, ZF5 AP-2alpha and AP-2gamma. The parameters for Match were set to 0.9 for core similarity and 0.75 for matrix similarity. See Figure 2 for the procedure followed.
References
-
- Berman BP, Nibu Y, Pfeiffer BD, Tomancak P, Celniker SE, Levine M, Rubin GM, Eisen MB. Exploiting transcription factor binding site clustering to identify cis-regulatory modules involved in pattern formation in the Drosophila genome. Proc Natl Acad Sci USA. 2002;99:757–762. doi: 10.1073/pnas.231608898. - DOI - PMC - PubMed
Publication types
MeSH terms
Substances
LinkOut - more resources
Full Text Sources
Other Literature Sources
