

Gas1 extends the range of Hedgehog action by facilitating its signaling
- PMID: 17504940
- PMCID: PMC1865494
- DOI: 10.1101/gad.1546307
Gas1 extends the range of Hedgehog action by facilitating its signaling
Abstract
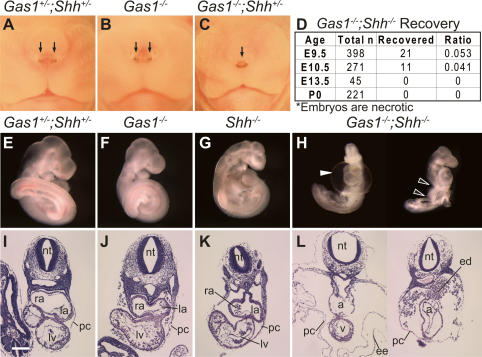
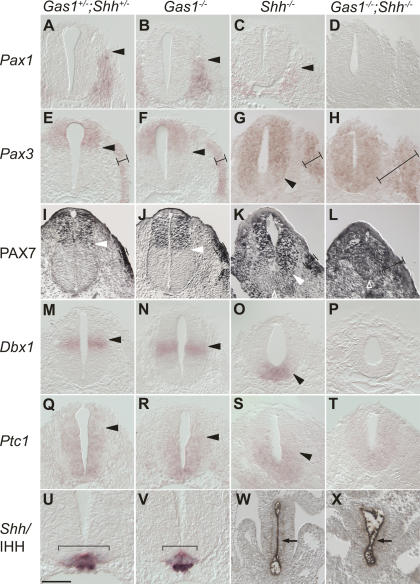
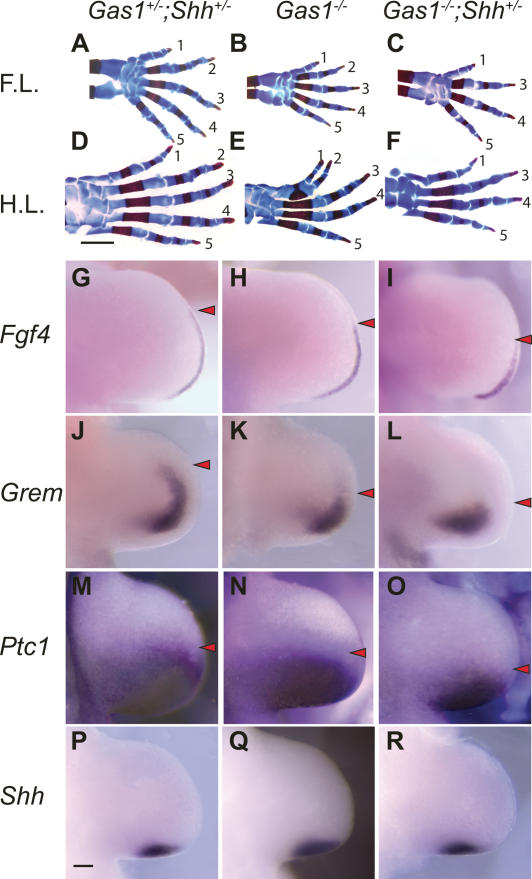
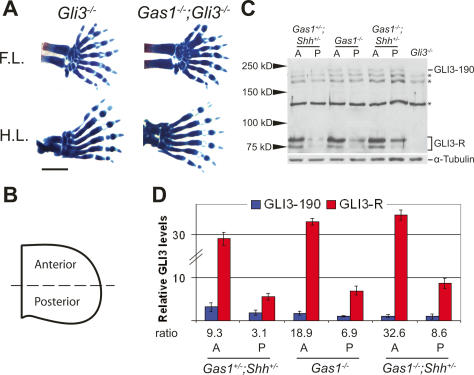
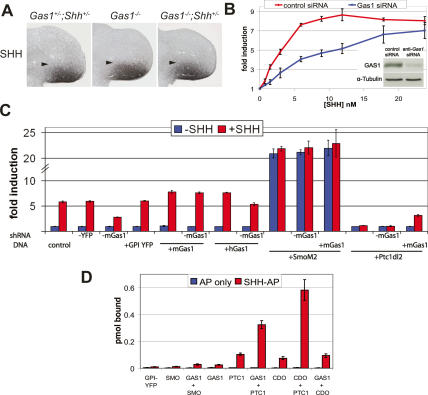
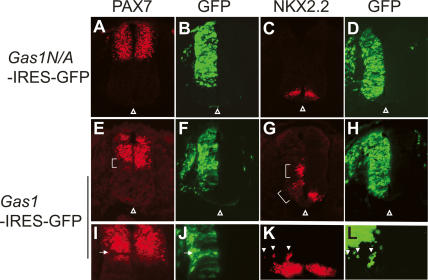
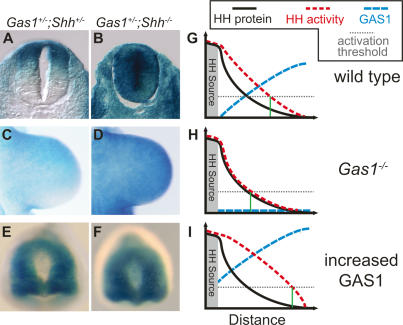
Cellular signaling initiated by Hedgehog binding to Patched1 has profound importance in mammalian embryogenesis, genetic disease, and cancer. Hedgehog acts as a morphogen to specify distinctive cell fates using different concentration thresholds, but our knowledge of how the concentration gradient is interpreted into the activity gradient is incomplete. The membrane protein Growth Arrest-Specific Gene 1 (GAS1) was thought to be a negative regulator of the Hedgehog concentration gradient. Here, we report unexpected genetic evidence that Gas1 positively regulates Hedgehog signaling in multiple developmental contexts, an effect particularly noticeable at regions where Hedgehog acts at low concentration. Using a combination of in vitro cell culture and in ovo electroporation assays, we demonstrate that GAS1 acts cooperatively with Patched1 for Hedgehog binding and enhances signaling activity in a cell-autonomous manner. Our data support a model in which GAS1 helps transform the Hedgehog protein gradient into the observed activity gradient. We propose that Gas1 is an evolutionarily novel, vertebrate-specific Hedgehog pathway regulator.
Figures
Similar articles
-
The Hedgehog-binding proteins Gas1 and Cdo cooperate to positively regulate Shh signaling during mouse development.Genes Dev. 2007 May 15;21(10):1244-57. doi: 10.1101/gad.1543607. Genes Dev. 2007. PMID: 17504941 Free PMC article.
-
Hedgehog signaling: cooking with Gas1.Sci STKE. 2007 Sep 11;2007(403):pe50. doi: 10.1126/stke.4032007pe50. Sci STKE. 2007. PMID: 17848687
-
Restriction of sonic hedgehog signalling during early tooth development.Development. 2004 Jun;131(12):2875-85. doi: 10.1242/dev.01163. Epub 2004 May 19. Development. 2004. PMID: 15151988
-
The role of Gas1 in embryonic development and its implications for human disease.Cell Cycle. 2007 Nov 1;6(21):2650-5. doi: 10.4161/cc.6.21.4877. Epub 2007 Aug 13. Cell Cycle. 2007. PMID: 17726382 Review.
-
Gas1 is a pleiotropic regulator of cellular functions: from embryonic development to molecular actions in cancer gene therapy.Mini Rev Med Chem. 2014;14(14):1139-47. doi: 10.2174/1389557514666141127142301. Mini Rev Med Chem. 2014. PMID: 25429664 Review.
Cited by
-
Hedgehog Signaling Components Are Expressed in Choroidal Neovascularization in Laser-induced Retinal Lesion.Acta Histochem Cytochem. 2016 Apr 28;49(2):67-74. doi: 10.1267/ahc.15036. Epub 2016 Apr 9. Acta Histochem Cytochem. 2016. PMID: 27239075 Free PMC article.
-
Menin: a scaffold protein that controls gene expression and cell signaling.Trends Biochem Sci. 2013 Aug;38(8):394-402. doi: 10.1016/j.tibs.2013.05.005. Epub 2013 Jul 10. Trends Biochem Sci. 2013. PMID: 23850066 Free PMC article. Review.
-
Neural-specific Sox2 input and differential Gli-binding affinity provide context and positional information in Shh-directed neural patterning.Genes Dev. 2012 Dec 15;26(24):2802-16. doi: 10.1101/gad.207142.112. Genes Dev. 2012. PMID: 23249739 Free PMC article.
-
Hedgehog Signaling in Intestinal Development and Homeostasis.Annu Rev Physiol. 2021 Feb 10;83:359-380. doi: 10.1146/annurev-physiol-031620-094324. Epub 2020 Oct 9. Annu Rev Physiol. 2021. PMID: 33035430 Free PMC article. Review.
-
The hidden hedgehog of the pituitary: hedgehog signaling in development, adulthood and disease of the hypothalamic-pituitary axis.Front Endocrinol (Lausanne). 2023 Jul 5;14:1219018. doi: 10.3389/fendo.2023.1219018. eCollection 2023. Front Endocrinol (Lausanne). 2023. PMID: 37476499 Free PMC article. Review.
References
-
- Ahn S., Joyner A.L., Joyner A.L. Dynamic changes in the response of cells to positive hedgehog signaling during mouse limb patterning. Cell. 2004;118:505–516. - PubMed
-
- Ahn S., Joyner A.L., Joyner A.L. In vivo analysis of quiescent adult neural stem cells responding to Sonic hedgehog. Nature. 2005;437:894–897. - PubMed
-
- Briscoe J., Ericson J., Ericson J. The specification of neuronal identity by graded Sonic Hedgehog signalling. Semin. Cell Dev. Biol. 1999;10:353–362. - PubMed
-
- Briscoe J., Sussel L., Serup P., Hartigan-O’Connor D., Jessell T.M., Rubenstein J.L., Ericson J., Sussel L., Serup P., Hartigan-O’Connor D., Jessell T.M., Rubenstein J.L., Ericson J., Serup P., Hartigan-O’Connor D., Jessell T.M., Rubenstein J.L., Ericson J., Hartigan-O’Connor D., Jessell T.M., Rubenstein J.L., Ericson J., Jessell T.M., Rubenstein J.L., Ericson J., Rubenstein J.L., Ericson J., Ericson J. Homeobox gene Nkx2.2 and specification of neuronal identity by graded Sonic hedgehog signalling. Nature. 1999;398:622–627. - PubMed
Publication types
MeSH terms
Substances
LinkOut - more resources
Full Text Sources
Other Literature Sources
Molecular Biology Databases
Miscellaneous