. 2007 May 15;21(10):1244-57.
doi: 10.1101/gad.1543607.

The Hedgehog-binding proteins Gas1 and Cdo cooperate to positively regulate Shh signaling during mouse development

Affiliations

The Hedgehog-binding proteins Gas1 and Cdo cooperate to positively regulate Shh signaling during mouse development

Benjamin L Allen et al. Genes Dev. .

Abstract

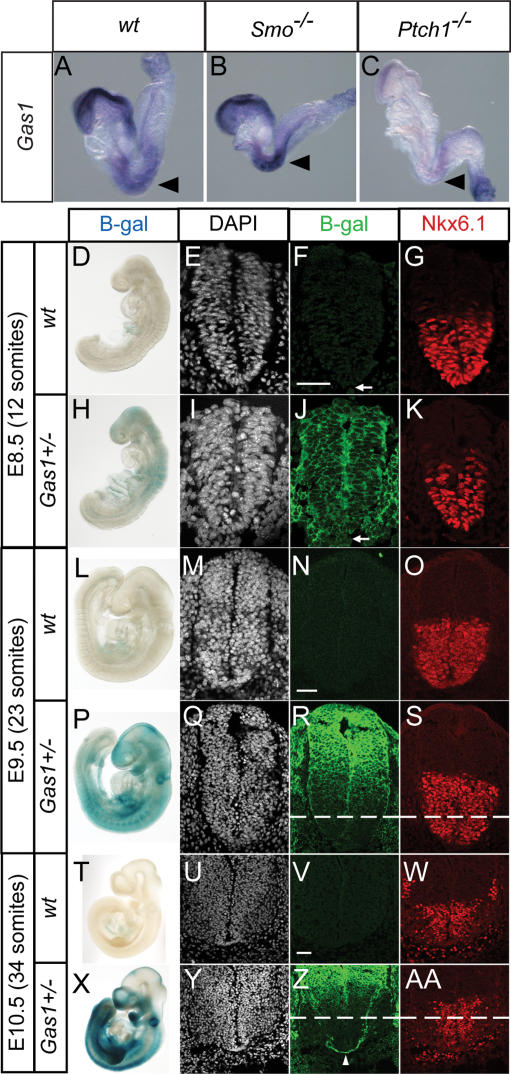
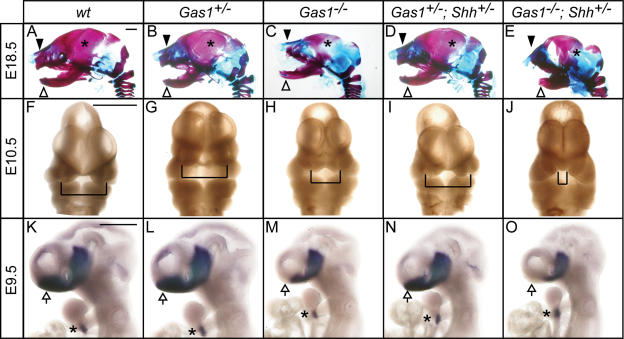
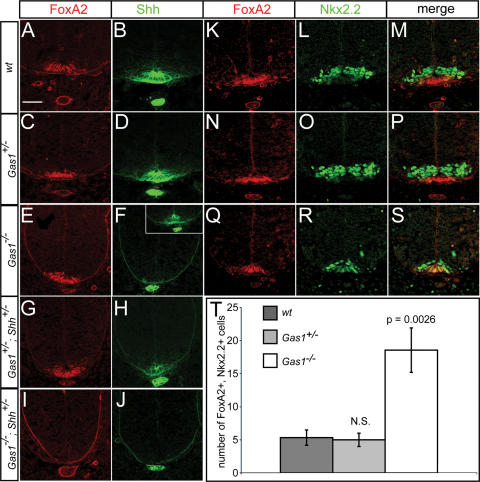
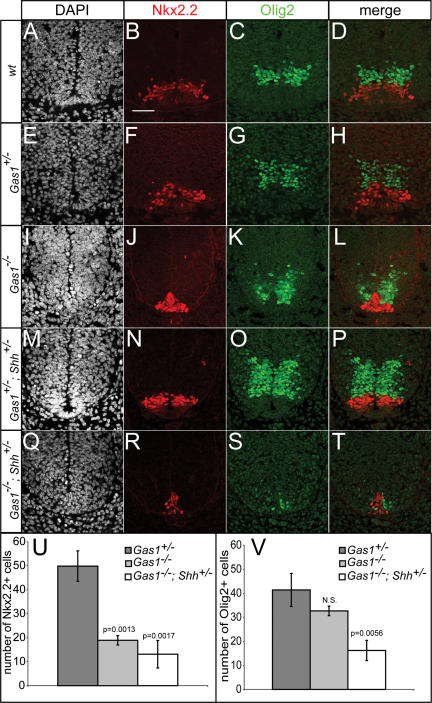
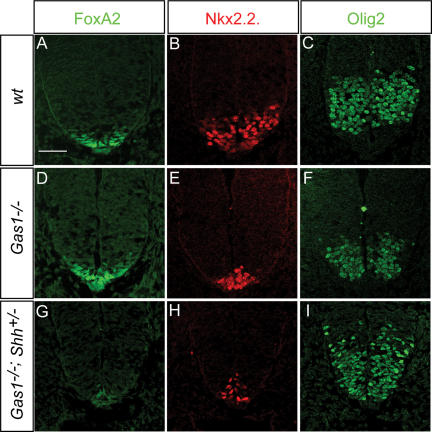
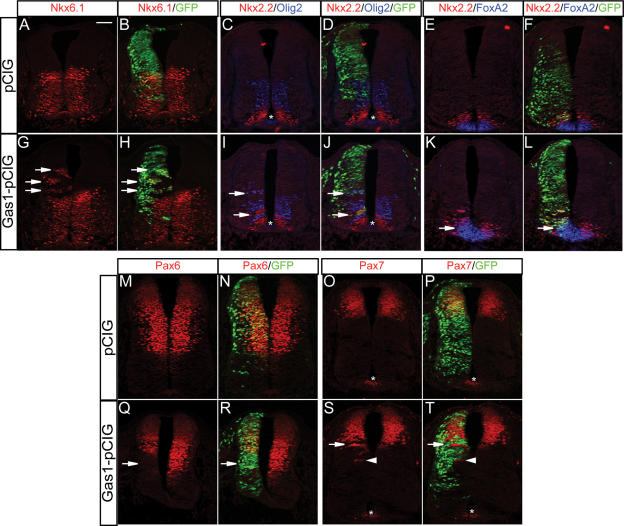
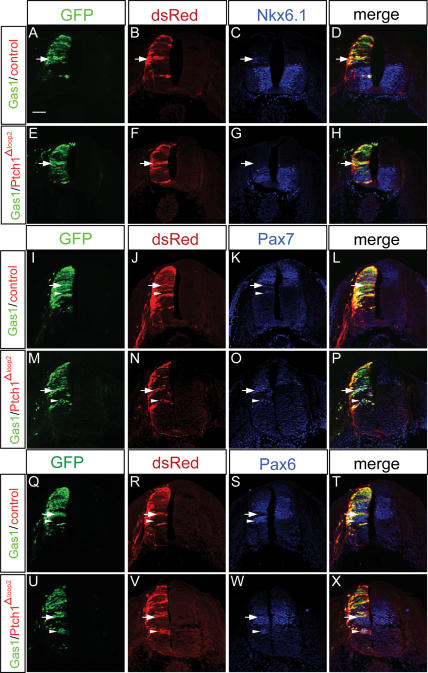
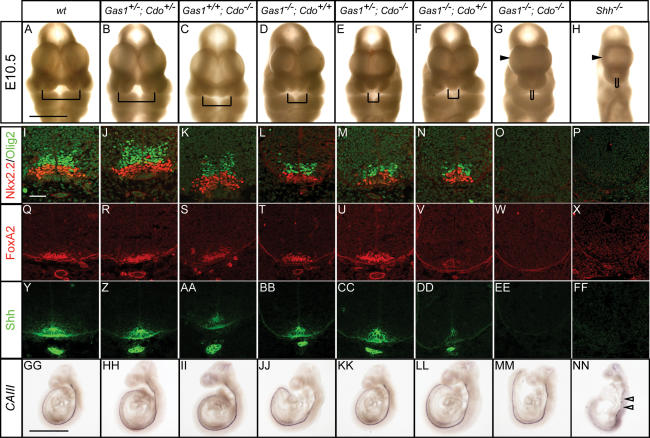
Hedgehog (Hh) signaling is critical for patterning and growth during mammalian embryogenesis. Transcriptional profiling identified Growth-arrest-specific 1 (Gas1) as a general negative target of Shh signaling. Data presented here define Gas1 as a novel positive component of the Shh signaling cascade. Removal of Gas1 results in a Shh dose-dependent loss of cell identities in the ventral neural tube and facial and skeletal defects, also consistent with reduced Shh signaling. In contrast, ectopic Gas1 expression results in Shh-dependent cell-autonomous promotion of ventral cell identities. These properties mirror those of Cdo, an unrelated, cell surface Shh-binding protein. We show that Gas1 and Cdo cooperate to promote Shh signaling during neural tube patterning, craniofacial, and vertebral development. Overall, these data support a new paradigm in Shh signaling whereby positively acting ligand-binding components, which are initially expressed in responding tissues to promote signaling, are then down-regulated by active Hh signaling, thereby modulating responses to ligand input.


Figures

Figure 1.
Figure 1.
Gas1 is a general negative target of Hedgehog signaling that is expressed in the ventral CNS during early stages of neural tube patterning. Analysis of Gas1 expression in wild-type (A), Smo−/− (B), and Ptch1−/− (C) eight- to 10-somite mouse embryos. Black arrowheads highlight Gas1 expression in somites. Whole-mount LacZ stain of wild-type (D,L,T) and Gas1+/− (H,P,X) embryos at the indicated stages. Embryos were sectioned at the forelimb level (for E9.5 and E10.5) and stained with DAPI (E,I,M,Q,U,Y), anti-β-gal (F,J,N,R,V,Z), and anti-Nkx6.1 (G,K,O,S,W,AA). Dashed lines in R, S, Z and AA denote the ventral limit of Gas1 expression in adjacent sections following antibody staining for β-galactosidase. Arrows in F and J denote notochord. Arrowhead in Z indicates Gas1-expressing commissural axons. Bars: F,N,V, 50 μm.
Figure 2.
Figure 2.
Genetic interactions between Gas1 and Shh result in craniofacial defects and abnormal forebrain patterning. Lateral view of E18.5 embryonic heads (A–E) following Alcian Blue (cartilage) and Alizarin Red (bone) skeletal staining. Black arrowheads denote maxillary processes; white arrowheads indicate mandibular components. Asterisks in A–E identify the parietal bone. (F–J) Frontal view of E10.5 embryonic heads. Brackets highlight the medial nasal processes. (K–O) In situ hybridization detection of Nkx2.1 expression in E9.5 embryonic forebrain. Arrows point to forebrain, while asterisks in K–O designate thyroid gland. Bars: A,F,K, 50 μm.
Figure 3.
Figure 3.
Compromised FP specification in Gas1−/− embryos is exacerbated by reducing Shh dosage. Antibody detection of FoxA2 (red; A,C,E,G,I) and Shh (green; B,D,F,H,J) in forelimb-level sections of E10.5 Gas1; Shh embryos. Inset in F denotes variable FP expression of Shh seen in Gas1−/− embryos. Double staining of wild-type (K,L,M), Gas1+/− (N,O,P), and Gas1−/− (Q,R,S) embryos with FoxA2 (red) and Nkx2.2 (green). (T) Quantitation of FoxA2, Nkx2.2 double-positive cells. Error bars represent the mean ± SD of three different embryos. P-values calculated from comparison of wild-type and Gas1−/− data by two-tailed Student’s t-test are listed. (N.S.) Not significant (p > 0.5). Bar: A, 50 μm.
Figure 4.
Figure 4.
Reduced Olig2+ and Nkx2.2+ cell specification in E10.5 Gas1; Shh compound mutants. DAPI (A,E,I,M,Q), Nkx2.2 (red; B,F,J,N,R), and Olig2 (green; C,G,K,O,S) detection in forelimb-level E10.5 sections of Gas1; Shh embryos. (D,H,L,P,T) Nkx2.2 and Olig2 merged images are shown. Quantitation of numbers of Nkx2.2+ (U) and Olig2+ (V) cells in Gas1+/− (dark-gray bars), Gas1−/− (light-gray bars), and Gas1−/−; Shh+/− (white bars) E10.5 embryos. Error bars represent the mean ± SD of three different embryos. P-values calculated from comparison with Gas1+/− data by two-tailed Student’s t-test are listed. (N.S.) Not significant (p > 0.1). Bar: B, 50 μm.
Figure 5.
Figure 5.
Reduced FoxA2+ and Nkx.2+, but not Olig2+ cell specification in E9.5 Gas1; Shh compound mutants. Forelimb-level sections of E9.5 wild-type (A–C), Gas1−/− (D–F), and Gas1−/−; Shh+/− (G–I) embryos were examined for FoxA2 (green; A,D,G), Nkx2.2 (red; B,E,H), and Olig2 (C,F,I) expression. Bar: A, 50 μm.
Figure 6.
Figure 6.
Ectopic expression of Gas1 promotes Shh-dependent cell fate specification in the developing chick neural tube. HH stage 19–22 chick neural tubes electroporated with pCIG (A–F,M–P) or Gas1–pCIG (G–L,Q–T) were sectioned at the forelimb level and stained with antibodies raised against Nkx6.1 (red; A,B,G,H), Nkx.2 and Olig2 (red and blue, respectively; C,D,I,J), Nkx2.2 and FoxA2 (red and blue, respectively; E,F,K,L), Pax 6 (M,N,Q,R), and Pax7 (O,P,S,T). Arrows in G, H, I, J, K, and L indicate ectopic expression of the indicated markers, while arrows in Q, R, S, and T denote repressed marker expression. Arrowheads in S and T identify non-cell-autonomous ventral expansion of Pax7 expression. Asterisks indicate nonspecific antibody background present in the FP of some sections. The results are representative of nine pCIG-electroporated embryos and 15 Gas1–pCIG electroporated embryos. Bar: A, 50 μm.
Figure 7.
Figure 7.
Coexpression of Gas1 and Ptch1Δloop2 blocks the Gas1-mediated promotion of Shh-dependent cell fates. HH stage 21–22 chick neural tubes electroporated with Gas1–pCIG and pCIR (A–D,I–L,Q–T) or Gas1–pCIG and Ptch1Δloop2-pCIR (E–H,M–P,U–X). Forelimb-level sections were examined for Nkx6.1 (blue; C,G), Pax7 (blue; K,O), and Pax6 (S,W) expression. Gas1-expressing cells are visualized with GFP (green), while pCIR and Ptch1Δloop2-pCIR-expressing cells are visualized with anti-DsRed antibodies (red). Arrows in A–D indicate Gas1/pCIR-expressing cells that ectopically express Nkx6.1. Arrows in E–H indicate similarly positioned cells that coexpress Gas1/Ptch1Δloop2 that do not express Nkx6.1. Arrows in I–L and Q–T denote Gas1/pCIR-expressing cells that down-regulate Pax7 and Pax6 expression, respectively; arrowheads indicate non-cell-autonomous expansion of Pax7 and Pax6. (M–P,U–X) Cells that coexpress Gas/Ptch1Δloop2 do not inhibit Pax7 and Pax6 expression (arrows). Cell-autonomous expansion of Pax7 and Pax6 is marked by arrowheads in M–P and U–X. The results are representative of six Gas1/pCIR-electroporated embryos and eight Gas1/Ptch1Δloop2 embryos. Bar: A, 50 μm.
Figure 8.
Figure 8.
Gas1; Cdo compound mutants display severely reduced Shh signaling. (A–G) Nasal process defects in E10.5 Gas1; Cdo embryos are shown. Brackets indicate the distance between nasal pits. (H) A Shh−/− E10.5 embryo is shown for comparison. Examination of Nkx2.2 (red) and Olig2 (green) expression in E10.5 Gas1; Cdo (I–O) and Shh−/− (P) forelimb-level sections. Forelimb-level expression of FoxA2 (red; Q–X) and Shh (green; Y–Z,AA–FF) in E10.5 Gas1; Cdo and Shh−/− embryos. In situ hybridization analysis of the notochord marker CAIII in E9.5 Gas1; Cdo embryos (GG–MM). Discontinuous CAIII expression is detected in a Shh−/− E9.5 embryo (NN), indicative of notochord degeneration. Arrows in NN highlight the broken CAIII expression. Bars: A, 1 mm; I, 50 μm; GG, 1 mm. For Gas1−/−; Cdo−/− embryos, a total of five embryos were examined with similar results.

Similar articles

Cited by

References

    1. Ahn S., Joyner A.L., Joyner A.L. Dynamic changes in the response of cells to positive hedgehog signaling during mouse limb patterning. Cell. 2004;118:505–516. - PubMed
    1. Ashe H.L., Briscoe J., Briscoe J. The interpretation of morphogen gradients. Development. 2006;133:385–394. - PubMed
    1. Bottcher R.T., Niehrs C., Niehrs C. Fibroblast growth factor signaling during early vertebrate development. Endocr. Rev. 2005;26:63–77. - PubMed
    1. Briscoe J., Ericson J., Ericson J. Specification of neuronal fates in the ventral neural tube. Curr. Opin. Neurobiol. 2001;11:43–49. - PubMed
    1. Briscoe J., Pierani A., Jessell T.M., Ericson J., Pierani A., Jessell T.M., Ericson J., Jessell T.M., Ericson J., Ericson J. A homeodomain protein code specifies progenitor cell identity and neuronal fate in the ventral neural tube. Cell. 2000;101:435–445. - PubMed

Publication types

MeSH terms