Dissection of a genetic locus influencing renal function in the rat and its concordance with kidney disease loci on human chromosome 1q21
- PMID: 17504948
- PMCID: PMC3153419
- DOI: 10.1152/physiolgenomics.00001.2007
Dissection of a genetic locus influencing renal function in the rat and its concordance with kidney disease loci on human chromosome 1q21
Abstract
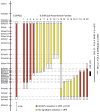
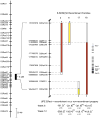
Previously, we conducted a genome scan on a population derived from the Dahl salt-sensitive hypertensive (S) and the spontaneously hypertensive rat (SHR) using urinary albumin excretion (UAE) as our primary measure of renal function. We identified 10 quantitative trait loci (QTL) linked to several renal and/or cardiovascular traits. In particular, linkage and subsequent congenic strain analysis demonstrated that the loci on chromosome 2 had a large and significant effect on UAE compared with the S rat. The present work sought to characterize the chromosome 2 congenic strain [S.SHR] by conducting a time-course analysis (week 4-20), including evaluating additional renal parameters, histology, electron microscopy, and gene expression/ pathway analysis. Throughout the time course the congenic strain consistently maintained a threefold reduction in UAE compared with S rats and was supported by the histological findings of significantly reduced glomerular, tubular and interstitial changes. Gene expression/pathway analysis performed at week 4, 12, and 20 revealed that pathways involved in cellular assembly and organization, cellular movement, and immune response were controlled differently between the S and congenic. When all the data are considered, the chromosome 2 congenic appears to attenuate renal damage primarily through an altered fibrotic response. Recombinant progeny testing was employed to reduce the QTL to approximately 1.5 cM containing several interesting candidate genes. The concordance of this rat QTL with renal disease loci on human chromosome 1q21 demonstrate that elucidating the causative gene and mechanism of the rat QTL may be of particular importance for understanding kidney disease in humans.
Figures


Similar articles
-
Genetic linkage of urinary albumin excretion in Dahl salt-sensitive rats: influence of dietary salt and confirmation using congenic strains.Physiol Genomics. 2006 Mar 13;25(1):39-49. doi: 10.1152/physiolgenomics.00150.2005. Physiol Genomics. 2006. PMID: 16534143
-
Genetic variants in Arhgef11 are associated with kidney injury in the Dahl salt-sensitive rat.Hypertension. 2012 Nov;60(5):1157-68. doi: 10.1161/HYPERTENSIONAHA.112.199240. Epub 2012 Sep 17. Hypertension. 2012. PMID: 22987919 Free PMC article.
-
Genetic linkage of albuminuria and renal injury in Dahl salt-sensitive rats on a high-salt diet: comparison with spontaneously hypertensive rats.Physiol Genomics. 2004 Jul 8;18(2):218-25. doi: 10.1152/physiolgenomics.00068.2004. Physiol Genomics. 2004. PMID: 15161966
-
Mapping genetic determinants of kidney damage in rat models.Hypertens Res. 2012 Jul;35(7):675-94. doi: 10.1038/hr.2012.77. Epub 2012 May 31. Hypertens Res. 2012. PMID: 22648060 Review.
-
Sympathetic regulation of renal function in stroke-prone spontaneously hypertensive rats congenic for chromosome 1 blood pressure quantitative trait loci.Clin Exp Pharmacol Physiol. 2008 Nov;35(11):1365-70. doi: 10.1111/j.1440-1681.2008.04990.x. Epub 2008 Jun 18. Clin Exp Pharmacol Physiol. 2008. PMID: 18565192 Review.
Cited by
-
Increased susceptibility to kidney injury by transfer of genomic segment from SHR onto Dahl S genetic background.Physiol Genomics. 2012 Jun 15;44(12):629-37. doi: 10.1152/physiolgenomics.00015.2012. Epub 2012 May 1. Physiol Genomics. 2012. PMID: 22548739 Free PMC article.
-
A mutation in the start codon of γ-crystallin D leads to nuclear cataracts in the Dahl SS/Jr-Ctr strain.Mamm Genome. 2013 Apr;24(3-4):95-104. doi: 10.1007/s00335-013-9447-1. Epub 2013 Feb 13. Mamm Genome. 2013. PMID: 23404175 Free PMC article.
-
Genes unlinked to the leptin receptor influence urinary albumin excretion in obese Zucker rats.Physiol Genomics. 2010 May;41(3):297-305. doi: 10.1152/physiolgenomics.90367.2008. Epub 2010 Feb 16. Physiol Genomics. 2010. PMID: 20159938 Free PMC article.
-
Increased Expression of Rififylin in A < 330 Kb Congenic Strain is Linked to Impaired Endosomal Recycling in Proximal Tubules.Front Genet. 2012 Aug 8;3:138. doi: 10.3389/fgene.2012.00138. eCollection 2012. Front Genet. 2012. PMID: 22891072 Free PMC article.
-
Will the real Dahl S rat please stand up?Am J Physiol Renal Physiol. 2019 Nov 1;317(5):F1231-F1240. doi: 10.1152/ajprenal.00359.2019. Epub 2019 Sep 23. Am J Physiol Renal Physiol. 2019. PMID: 31545925 Free PMC article. No abstract available.
References
-
- Aitman TJ, Glazier AM, Wallace CA, Cooper LD, Norsworthy PJ, Wahid FN, Al-Majali KM, Trembling PM, Mann CJ, Shoulders CC, Graf D, St Lezin E, Kurtz TW, Kren V, Pravenec M, Ibrahimi A, Abumrad NA, Stanton LW, Scott J. Identification of Cd36 (Fat) as an insulin-resistance gene causing defective fatty acid and glucose metabolism in hypertensive rats. Nat Genet. 1999;21:76–83. - PubMed
-
- Bergman S, Key BO, Kirk KA, Warnock DG, Rostant SG. Kidney disease in the first-degree relatives of African-Americans with hypertensive end-stage renal disease. Am J Kidney Dis. 1996;27:341–346. - PubMed
-
- Brembeck FH, Rosario M, Birchmeier W. Balancing cell adhesion and Wnt signaling, the key role of beta-catenin. Curr Opin Genet Dev. 2006;16:51–59. - PubMed
-
- Brown DM, Provoost AP, Daly MJ, Lander ES, Jacob HJ. Renal disease susceptibility and hypertension are under independent genetic control in the fawn-hooded rat. Nat Genet. 1996;12:44–51. - PubMed
Publication types
MeSH terms
Grants and funding
LinkOut - more resources
Full Text Sources
Medical

