. 2007 May 16;26(10):2540-51.
doi: 10.1038/sj.emboj.7601696.

Agrobacterium ParA/MinD-like VirC1 spatially coordinates early conjugative DNA transfer reactions

Affiliations

Agrobacterium ParA/MinD-like VirC1 spatially coordinates early conjugative DNA transfer reactions

Krishnamohan Atmakuri et al. EMBO J. .

Abstract

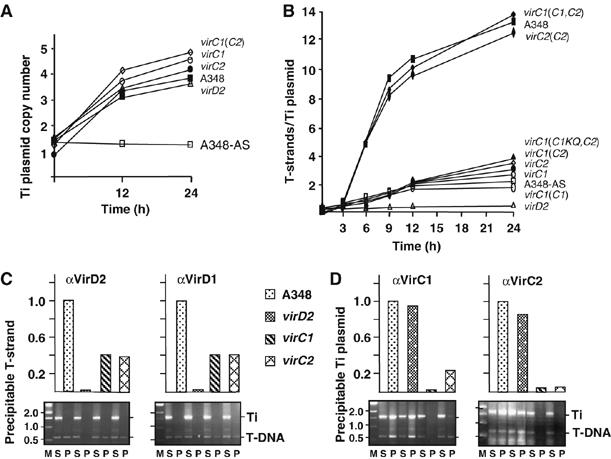
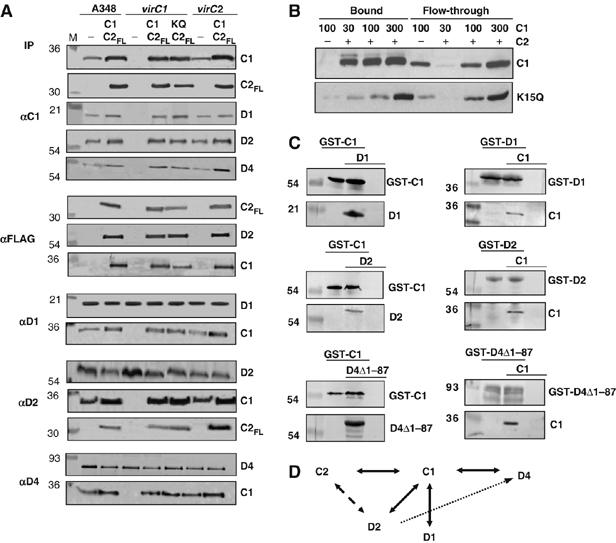
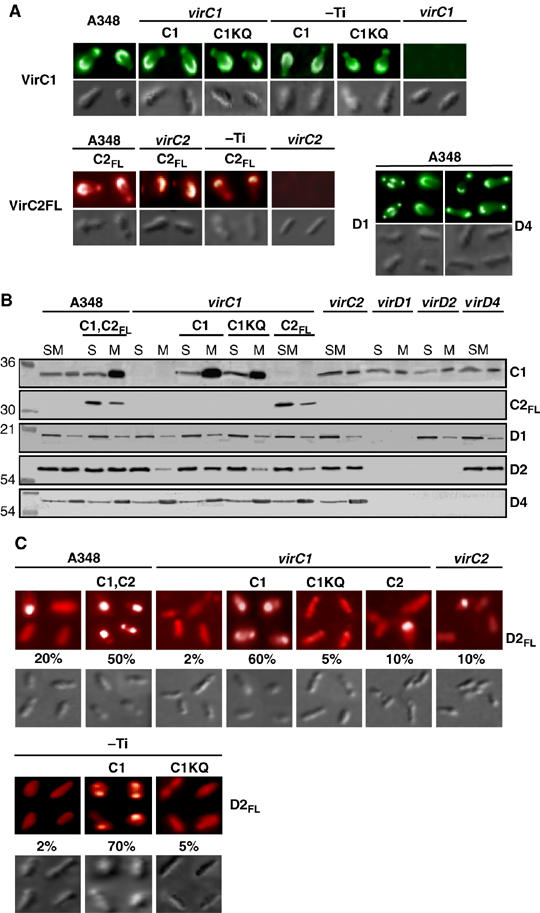
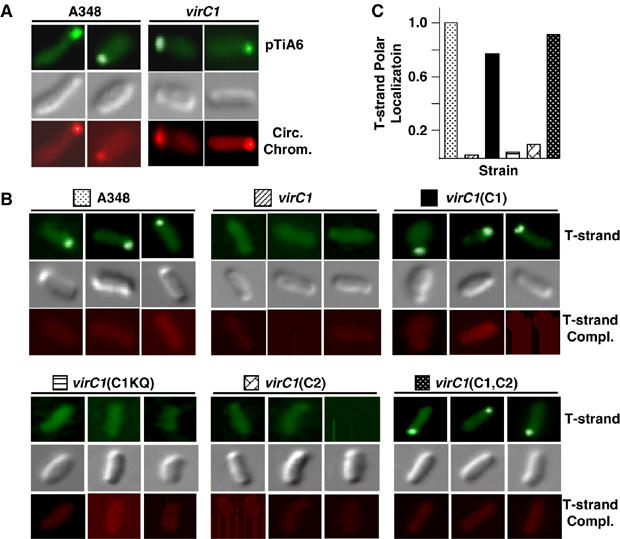
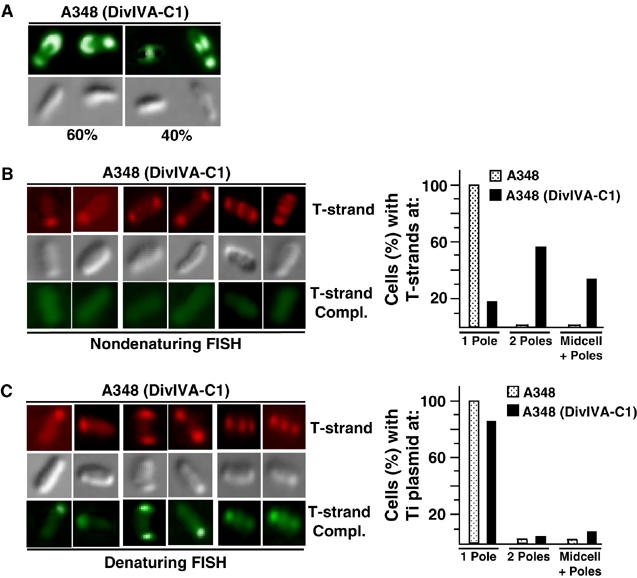
Agrobacterium tumefaciens translocates T-DNA through a polar VirB/D4 type IV secretion (T4S) system. VirC1, a factor required for efficient T-DNA transfer, bears a deviant Walker A and other sequence motifs characteristic of ParA and MinD ATPases. Here, we show that VirC1 promotes conjugative T-DNA transfer by stimulating generation of multiple copies per cell of the T-DNA substrate (T-complex) through pairwise interactions with the processing factors VirD2 relaxase, VirC2, and VirD1. VirC1 also associates with the polar membrane and recruits T-complexes to cell poles, the site of VirB/D4 T4S machine assembly. VirC1 Walker A mutations abrogate T-complex generation and polar recruitment, whereas the native protein recruits T-complexes to cell poles independently of other polar processing factors (VirC2, VirD1) or T4S components (VirD4 substrate receptor, VirB channel subunits). We propose that A. tumefaciens has appropriated a progenitor ParA/MinD-like ATPase to promote conjugative DNA transfer by: (i) nucleating relaxosome assembly at oriT-like T-DNA border sequences and (ii) spatially positioning the transfer intermediate at the cell pole to coordinate substrate-T4S channel docking.


Figures

Figure 1
Figure 1
Quantitative effects of VirC1 and VirC2 on generation of the T-DNA transfer intermediate. (A) Increase in Ti plasmid copy number in response to AS induction. Strains: A348 WT strain; virD2, Mx311; virC1, Mx365 (this mutation is polar on downstream virC2); virC2, Mx364; virC1(C2), Mx365(pKA114) producing VirC2 from the IncP replicon. All strains except for A348-AS were induced with AS for the times indicated at 22°C. (B) Effects of VirC proteins on cellular levels of T-strand. Strains: same as (A) plus virC1(C1,C2), Mx365(pKAB188) producing VirC1 and VirC2 from an IncP replicon; virC1(C1KQ,C2), Mx365(pKAB190) producing VirC1K15Q, and VirC2 from an IncP replicon. T-strand levels were determined as described in the text. (C, D) Effects of VirC proteins on accumulation of the VirD2–T-strand intermediate. Strains listed at center were treated without (for VirD2) or with (for VirD1, VirC1, and VirC2) formaldehyde before cell lysis. Antibodies listed at the top of each histogram were used to immunoprecipitate the cognate Vir protein. Levels of co-precipitated T-strand or Ti plasmid were determined by quantitative (upper histogram) and nonquantitative (lower gel) ChIP (TrIP) assays as described previously (Cascales and Christie, 2004b). Upper histogram: T-strand or Ti plasmid levels in WT strain A348 are normalized to 1.0, and levels in vir mutant strains are depicted as a fraction of WT levels. Lower gel: agarose gels showing PCR amplification products generated with primers against a Ti plasmid gene fragment (Ti) and a T-DNA fragment (T-DNA). Lanes: M, molecular mass markers with sizes in kb listed at left; PCR products were generated using supernatant (nonprecipitated) (S) and immunoprecipitated (P) material.
Figure 2
Figure 2
Protein–protein interactions among the VirC and VirD subunits. (A) Co-immunoprecipitation of VirC and VirD proteins. Strains: A348 WT strain; virC1, virC1 mutant Mx365; virC2, virC2 mutant Mx364. Strains were assayed for formation of immunoprecipitable complexes without (−) or with VirC proteins synthesized from an IncP replicon: A348(C1,C2FL), A348(pKAB192); virC1(C1,C2FL), Mx365(pKAB192); virC1(C1KQ,C2FL), Mx365(pKAB193); virC2(C1,C2FL), Mx364(pKAB192). Antibodies used for immunoprecipitation (IP) are listed at left and proteins in the immunoprecipitates detected by immunoblotting at the right. M, Molecular mass markers with sizes (kDa) are listed at left. (B) Co-retention of VirC1 and VirC2-T7 by affinity chromatography. Purified VirC1 or VirC1K15Q in the amounts indicated at top (in ng) were mixed with a T7-tag antibody agarose (−) or the affinity resin pre-bound with His-T7-VirC2 (+). VirC1 and VirC1K15Q in the flow-through and bound fractions were detected by western immunoblotting with anti-VirC1 antibodies. (C) GST-pulldown of VirC1 and VirD proteins. Strain: E. coli BL21(DE3). Plasmids (in parantheses) were introduced into this strain for production of the following protein(s): GST-C1 (pOB1); GST-C1+D1 (pOB1,pKA204); D1 (pKA204); GST-C1+D2 (pOB1,pKA205); D2 (pKA205); GST-C1+D4Δ1-87 (pOB1,pKA207); D4Δ1-87 (pKA207); GST-D1, (pKVD16); GST-D1+C1 (pKVD16,pKA208), C1 (pKA208); GST-D2 (pKA29); GST-D2+C1 (pKA29,pKA208); GST-D4Δ1-87 (pKA28); GST-D4Δ1-87+C1 (pKA28,pKA208). Vir proteins detected by GST-pulldown are shown to the right, Molecular mass markers with sizes (kDa) are listed to the left. (D) A proposed interaction network for the VirC and VirD subunits. Reciprocal interactions detected by co-immunoprecipitation are depicted with solid arrows. Interactions between VirD1 and VirD2 and VirD2 (as a component of the VirD2–T-strand intermediate) and the VirD4 receptor were not detected by co-immunoprecipitation (broken arrow), but likely form transiently or via another factor (see text).
Figure 3
Figure 3
VirC polar localization and VirC1-mediated polar recruitment of VirD2 relaxase. (A) Localization of VirC1 and VirC2FL at A. tumefaciens poles. Cells were induced for 16-18 h with 200 μM AS and assayed for Vir protein localization by IFM. Strains: A348; virC1, Mx365; virC2, Mx364; and pTi-, Ti-plasmidless strain A136 carrying the virA/virG two-component regulatory system in the chromosome. Proteins listed were synthesized from the following plasmids: C1 (pKAB187), C1KQ (pKAB189) C2FL (pKAB194). Upper colored panels: VirC1, VirC1KQ, VirD1, and VirD4 were detected with Alexa fluor® 488 goat-anti-rabbit IgG as the 2o antibody. VirC2FL was detected with Rhodamine Red™-X goat anti-mouse IgG. Lower panels: corresponding DIC images by Nomarski microscopy. (B) Effects of VirC1 on VirD2 membrane binding. Subcellular fractions of AS-induced cells were analyzed for Vir protein content by western immunoblotting. Strains and Vir proteins synthesized from IncP replicons: as described in (A) plus virD1, Mx306; virD2, Mx311; virD4, Mx355; C1, C2FL (pKAB192). Mutations in Mx365, Mx306, Mx311 are polar on downstream genes (Stachel and Nester, 1986). (S) total soluble (cytoplasmic) and (M) membrane fractions. Molecular mass markers at left with sizes listed in kilodaltons. (C) VirC1 polar recruitment of VirD2. Strains: as described in (A, B), but also producing FLAG-tagged VirD2 (D2FL) from plasmid pKA196. Upper: AS-induced cells were examined by IFM for VirD2FL localization with Rhodamine Red™-X goat anti-mouse IgG. Lower: corresponding DIC images by Nomarski microscopy. The percentage of cells (>1000 cells examined) displaying polar fluorescence is listed.
Figure 4
Figure 4
VirC1-mediated polar recruitment of the T-strand intermediate. (A) Polar localization of pTiA6 and the circular chromosome in A348 and the virC1(Mx365) mutant. The Ti plasmid and chromosome were detected by FISH with Alexa Fluor® 488-tagged (green; top) and Alexa Fluor® 555-tagged (red; bottom) DNA probes, respectively. Cells were visualized by Nomarski microscopy (gray; middle). (B) VirC1 polar recruitment of the T-strand. AS-induced cells were examined for localization of the ss T-strand by a modified, nondenaturing FISH assay (Materials and methods). Strains: A348; virC1, Mx365; virC1(C1), Mx365(pKAB187); virC1(C1KQ), Mx365(pKAB189); virC1(C2), Mx365(pKA114); virC1(C1,C2), Mx365(pKAB188). The T-strand was detected with a ssDNA-specific probe fluorescently tagged with Alexa Fluor® 488 (green; top). Non-transferred strand (T-strand complex) was assayed for with the ssDNA-specific complementary probe fluorescently tagged with Alexa Fluor® 555 (red; bottom). Cells were visualized by Nomarski microscopy (gray; middle). (C) Relative numbers of cells displaying T-strand polar positioning. The histogram represents the numbers of cells from strains analyzed in (B) displaying polar-localization of the T-strand. WT cells with polar foci are normalized to 1.0 and the numbers of vir mutant cells with polar foci are presented as a fraction of the WT profile. Values were obtained by examination of least 500 cells for each strain.
Figure 5
Figure 5
DivIVA–VirC1 recruits the VirD2–T-strand complex to mid-cell from cell poles. (A) DivIVA–VirC1 localizes to mid-cell. A348(pKAB202) cells producing DivIVA–VirC1 were induced for 16–18 h in ABIM pH 5.5 with 200 μM AS and subjected to IFM. VirC1 was detected using secondary antibodies tagged with Alexa fluor® 488 goat-anti-rabbit IgG (green; top panels). Corresponding Nomarski microscopy images (lower panels). Numbers below bottom panels represent the percentage of cells (>1000 examined) with polar or mid-cell fluorescence. (B, C) DivIVA–VirC1 relocalizes the VirD2–T-strand to mid-cell. Cells from A348 expressing DivIVA–VirC1 were induced 24 h in ABIM pH 5.5, treated with 1.5% formaldehyde, fixed on 0.1% poly-L-lysine-coated cover glass and subjected to FISH analyses. Under nondenaturing conditions (B), only the T-strand was detected by hybridizing with Alexa Fluor® 555-tagged (red; top), whereas under denaturing conditions (C) T-strand and Ti plasmid (T-strand complement) were detected with Alexa Fluor® 555-tagged (red; top) and Alexa Fluor® 488-tagged (green; bottom) ssDNA-specific probes, respectively (see Materials and methods). Corresponding cells were visualized by Nomarski microscopy (gray; middle). The histograms represents the percentages of cells (>500 examined) of A348(DivIVA–VirC1) exhibiting unipolar, bipolar, or mid-cell+polar positioning of the VirD2–T-strand complex (T-strand-specific probe, nondenaturing FISH; (B)) or Ti plasmid (T-strand complement probe, denaturing FISH; (C)).

Similar articles

Cited by

References

    1. Atmakuri K, Cascales E, Christie PJ (2004) Energetic components VirD4, VirB11 and VirB4 mediate early DNA transfer reactions required for bacterial type IV secretion. Mol Microbiol 54: 1199–1211 - PMC - PubMed
    1. Atmakuri K, Ding Z, Christie PJ (2003) VirE2, a type IV secretion substrate, interacts with the VirD4 transfer protein at cell poles of Agrobacterium tumefaciens. Mol Microbiol 49: 1699–1713 - PMC - PubMed
    1. Bignell C, Thomas CM (2001) The bacterial ParA-ParB partitioning proteins. J Biotechnol 91: 1–34 - PubMed
    1. Cascales E, Christie PJ (2004a) Agrobacterium VirB10, an ATP energy sensor required for type IV secretion. Proc Natl Acad Sci USA 101: 17228–17233 - PMC - PubMed
    1. Cascales E, Christie PJ (2004b) Definition of a bacterial type IV secretion pathway for a DNA substrate. Science 304: 1170–1173 - PMC - PubMed

Publication types

MeSH terms