

Hearing loss in aging
- PMID: 17505600
- PMCID: PMC9443538
- DOI: 10.1016/s1808-8694(15)31123-x
Hearing loss in aging
Abstract
Aging is a natural consequence of a society developing process. The city of São Paulo has almost one million people who are above sixty years of age. Age-related hearing loss equals the total hearing loss resulted from cell degeneration caused by noise exposure, ototoxic agents and the loss caused by disorders and medical treatments.
Aim: To study age-related hearing degeneration by means of higher thresholds and hearing sensitivity measures.
Materials and methods: Cross-sectional contemporary cohort study in which we assessed 211 elderly patients with mean age of 75.24 years, of whom 61 were females and 150 were males. The subjects were submitted to an interview and a conventional audiometric assessment; and later divided into four groups according to age range.
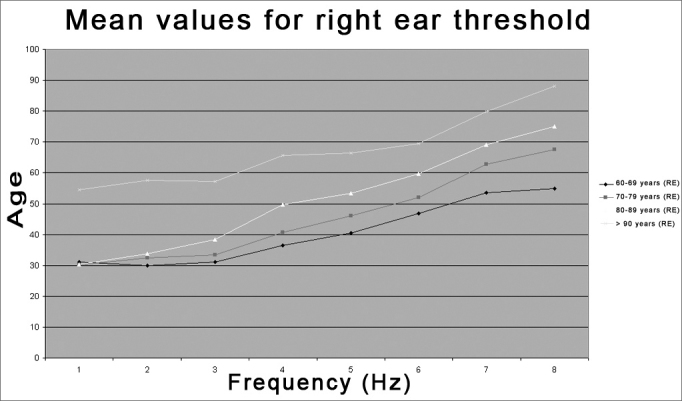
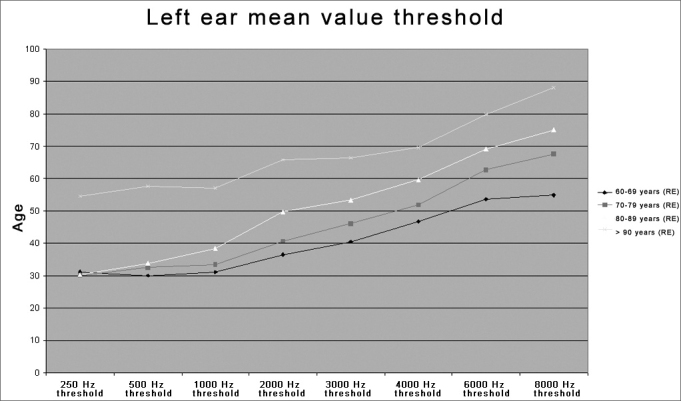
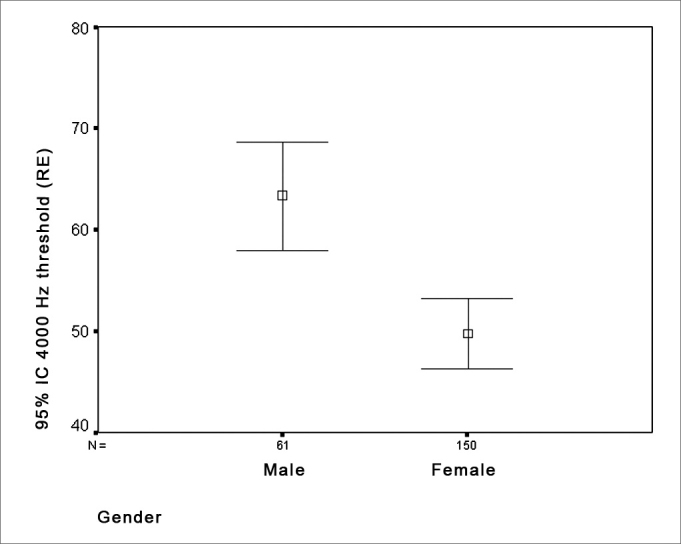
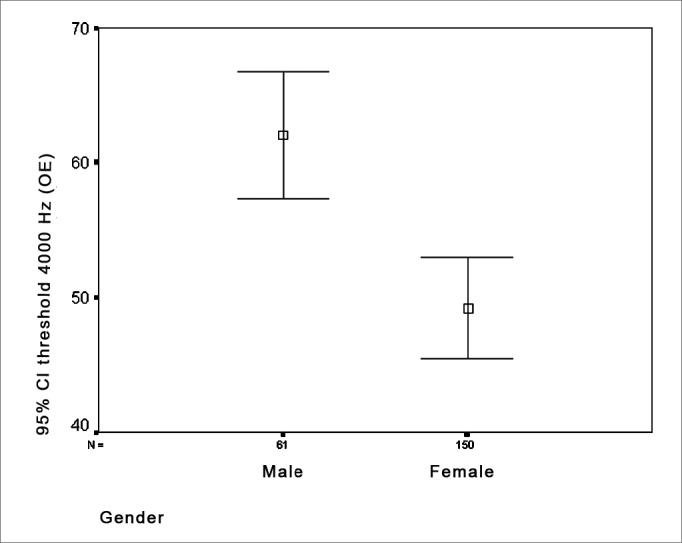
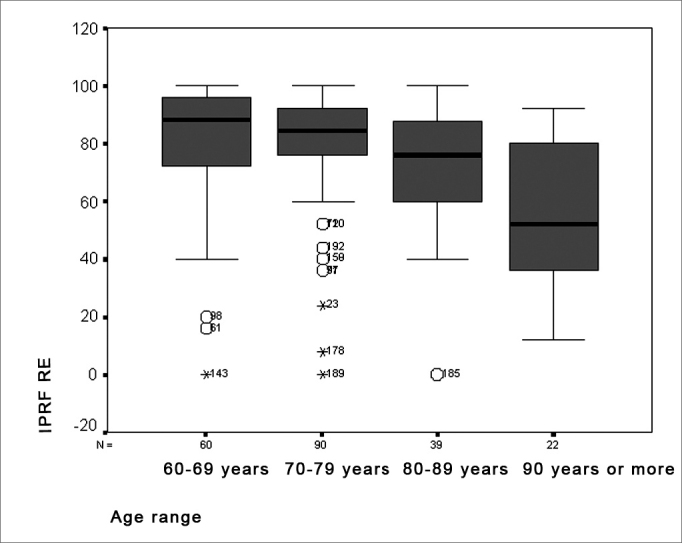
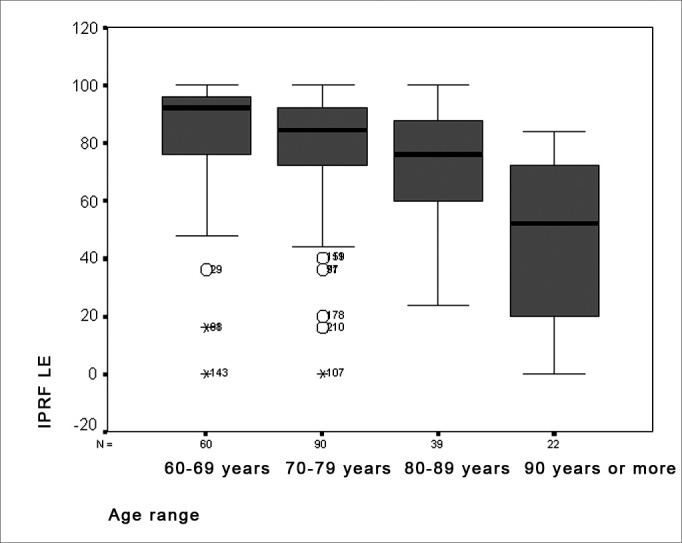
Results: Significant threshold drop in the four established age groups, decrease in speech recognition ratio, and a significant difference regarding gender.
Conclusion: As age advanced there was a gradual increase in hearing loss, men showed a lower threshold in the 4000 Hz frequency when compared to women, and in the speech intelligibility test there was also a gradual decrease with aging.
Figures
Similar articles
-
Increases in the Rate of Age-Related Hearing Loss in the Older Old.JAMA Otolaryngol Head Neck Surg. 2017 Jan 1;143(1):41-45. doi: 10.1001/jamaoto.2016.2661. JAMA Otolaryngol Head Neck Surg. 2017. PMID: 27632707
-
Clinical observation on hearing conditions of centenarians in northern district of China.Acta Otolaryngol. 2015 May;135(5):451-8. doi: 10.3109/00016489.2014.984876. Epub 2015 Mar 5. Acta Otolaryngol. 2015. PMID: 25739867
-
Hearing in 70 and 75 year old people: results from a cross sectional and longitudinal population study.Am J Otolaryngol. 1981 Feb;2(1):22-9. doi: 10.1016/s0196-0709(81)80005-1. Am J Otolaryngol. 1981. PMID: 6972711
-
[Hearing Loss and Speech Recognition in the Elderly].Laryngorhinootologie. 2017 Nov;96(11):759-764. doi: 10.1055/s-0043-119388. Epub 2017 Nov 13. Laryngorhinootologie. 2017. PMID: 29132188 Review. German.
-
The World Health Organization's hearing-impairment grading system: an evaluation for unaided communication in age-related hearing loss.Int J Audiol. 2019 Jan;58(1):12-20. doi: 10.1080/14992027.2018.1518598. Epub 2018 Oct 15. Int J Audiol. 2019. PMID: 30318941 Free PMC article. Review.
Cited by
-
Neural correlates of visual stimulus encoding and verbal working memory differ between cochlear implant users and normal-hearing controls.Eur J Neurosci. 2021 Aug;54(3):5016-5037. doi: 10.1111/ejn.15365. Epub 2021 Jul 9. Eur J Neurosci. 2021. PMID: 34146363 Free PMC article.
-
Age- and Gender-Related Mean Hearing Threshold in a Highly-Screened Population: The Korean National Health and Nutrition Examination Survey 2010-2012.PLoS One. 2016 Mar 7;11(3):e0150783. doi: 10.1371/journal.pone.0150783. eCollection 2016. PLoS One. 2016. PMID: 26950935 Free PMC article.
-
Hearing loss in the elderly: History of occupational noise exposure.Int Arch Otorhinolaryngol. 2013 Apr;17(2):179-83. doi: 10.7162/S1809-97772013000200010. Int Arch Otorhinolaryngol. 2013. PMID: 25992010 Free PMC article.
-
Pure tone and speech audiometry of presbyacusis in a tertiary hospital in Kaduna, Nigeria: a cross-sectional study.Pan Afr Med J. 2024 Aug 22;48:184. doi: 10.11604/pamj.2024.48.184.35404. eCollection 2024. Pan Afr Med J. 2024. PMID: 39677551 Free PMC article.
-
The Effect of Coenzyme Q10 on Tinnitus Severity and Sleep Quality in Patients with Presbycusis.Iran J Otorhinolaryngol. 2025;37(1):33-39. doi: 10.22038/ijorl.2024.79602.3681. Iran J Otorhinolaryngol. 2025. PMID: 39850225 Free PMC article.
References
-
- IBGE [online]. Tabuas completas de mortalidade; 2003. Disponível em: URL: http://www.ibge.gov.br em população / Tabuas completas de mortalidade. Acessado em: 25/06/2005.
-
- IBGE [online]. Fundação Instituto Brasileiro de Geografia e Estatística, 2002. Censo Demográfico, 2000. Disponível em: URL: http://www.ibge.gov.br. Acessado em: 25/06/2005.
-
- Estatuto do Idoso. LEI N° 10.741, de 1 de outubro de 2003.
-
- Saad PM, Camargo ABM. O envelhecimento populacional e suas conseqüências. São Paulo em Perspectiva. São Paulo: Fundação SEADE. 1989;3(3):40–45.
-
- Zimerman GI. Velhice. Aspectos biopsicossociais. Artes Médicas Sul; Porto Alegre: 2000.
MeSH terms
LinkOut - more resources
Full Text Sources
Research Materials
