. 2007 May-Jun;23(3):585-98.
doi: 10.1021/bp070011x. Epub 2007 May 17.

Enhanced bacterial protein expression during auto-induction obtained by alteration of lac repressor dosage and medium composition

Affiliations

Enhanced bacterial protein expression during auto-induction obtained by alteration of lac repressor dosage and medium composition

Paul G Blommel et al. Biotechnol Prog. 2007 May-Jun.

Abstract

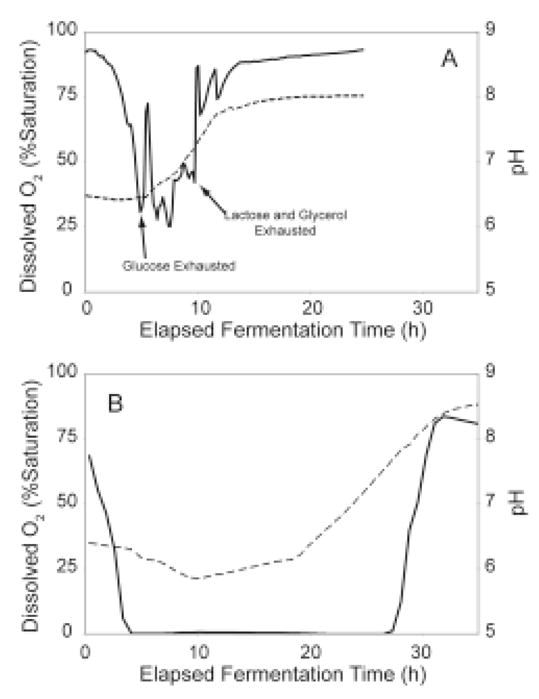
The auto-induction method of protein expression in E. coli is based on diauxic growth resulting from dynamic function of lac operon regulatory elements (lacO and LacI) in mixtures of glucose, glycerol, and lactose. The results show that successful execution of auto-induction is strongly dependent on the plasmid promoter and repressor construction, on the oxygenation state of the culture, and on the composition of the auto-induction medium. Thus expression hosts expressing high levels of LacI during aerobic growth exhibit reduced ability to effectively complete the auto-induction process. Manipulation of the promoter to decrease the expression of LacI altered the preference for lactose consumption in a manner that led to increased protein expression and partially relieved the sensitivity of the auto-induction process to the oxygenation state of the culture. Factorial design methods were used to optimize the chemically defined growth medium used for expression of two model proteins, Photinus luciferase and enhanced green fluorescent protein, including variations for production of both unlabeled and selenomethionine-labeled samples. The optimization included studies of the expression from T7 and T7-lacI promoter plasmids and from T5 phage promoter plasmids expressing two levels of LacI. Upon the basis of the analysis of over 500 independent expression results, combinations of optimized expression media and expression plasmids that gave protein yields of greater than 1000 mug/mL of expression culture were identified.


Figures

Figure 1
Figure 1
SDS-PAGE demonstration of scale dependence during auto-induction. Total cell lysates are shown for three structural genomics target proteins (from left to right At3g17820, At1g65020, BC058837) expressed as MBP fusions from a T5-lacIq expression vector. A, expression in the original auto-induction medium formulation (7). The level of expression in growth blocks was typically much lower than obtained in 2-L bottles. B, expression of the same targets in a provisionally revised auto-induction medium. With the indicated modifications in carbon sources, the correlation between growth blocks (small-scale) and 2-L bottles (large-scale) was improved. This figure was assembled from pictures of different gels. No modifications were made to the images other than cutting, pasting, and resizing using Adobe Photoshop.
Figure 2
Figure 2
Map of expression plasmids used in this study. pFN6K has a T7 promoter, pET32 has a T7-lacO promoter, and pVP38, pVP58K, pVP61K and pVP62K have a T5-lacO1-lacO2 promoter. pVP38K and pVP61K have the lacIq promoter controlling expression of LacI, while pVP58K and pVP62K contain the wild-type lacI promoter. Photinus luciferase was expressed from plasmids A, B, and C. Enhanced green fluorescent protein was expressed from pVP61K and pVP62K, shown in D. pVP61K and pVP62K also contain the coding region for tobacco vein mottling virus protease (TVMV) under control of the tet promoter. The expression strains used in this study do not overexpress the tet repressor, leading to low level, constitutive expression of TVMV. Due to the presence of a TVMV recognition site between the MBP and eGFP, the fusion protein is cleaved in vivo to liberate His7-eGFP.
Figure 3
Figure 3
Response surfaces arising from factorial design changes in the composition of auto-induction medium and changes in LacI dosing. A, expression from T5-lacI plasmids in media containing methionine (left side) or selenomethionine (right side). B, expression from T5-lacIq plasmids in media containing methionine (left side) or selenomethionine (right side). C, estimated expression of eGFP from T7-lacI plasmids in media containing methionine (left side) or selenomethionine (right side) using normalization factor for relationship of luciferase and eGFP expression levels described in Materials and Methods. The response models were not extended to zero lactose concentration due to highly non-linear response with these medium compositions.
Figure 4
Figure 4
SDS-PAGE analysis of eGFP expression from T5-lacI-eGFP. Lanes 1, 2 and 3 show total cell lysate, soluble fraction, and insoluble fraction obtained from expression in a methionine auto-induction medium containing 0.025% (w/v) glucose, 0.9% (w/v) glycerol, and 0.45% (w/v) lactose. Lanes 4, 5 and 6 show total cell lysate, soluble fraction and insoluble fraction obtained from expression in selenomethionine auto-induction medium with the same carbon source composition.
Figure 5
Figure 5
LabChip90 protein electropherograms showning luciferase expression from the indicated luciferase expression plasmids. Reported luciferase expression levels were 1820 μg/mL (T5-lacI, top), 500 μg/mL (T5-lacIq, middle), and 640 μg/mL (T7-lacI, bottom). Each protein expression was obtained from methionine auto-induction medium containing 0.025% (w/v) glucose, 0.45% (w/v) lactose and 0.9% (w/v) glycerol.
Figure 6
Figure 6
Dissolved O2 (solid lines) and pH (dashed lines) profiles for aerobic (top) and O2-limited (bottom) growth of E. coli B834(DE3) T7-Luc completed in a Sixfors instrumented fermenter. In both cases, the dissolved O2 initially dropped as increasing cell density raised the metabolic O2 demand. For the aerobic growth, the dissolved O2 was maintained above 10% of saturation during the course of the experiment. The dissolved O2 fluctuated in the aerobic fermentation during transitions from use of one carbon source to another and due to manual adjustments in agitation made to maintain aerobic conditions. The arrows indicate the times where glucose, lactose, and glycerol were exhausted. For the O2-limited growth, dissolved O2 was below measurable levels for much of the experiment because the metabolic demand exceeds the amount of O2 supplied. After ~10 h for the aerobic case and ~28 h for the O2-limited case, most of the carbon sources were consumed and the dissolved O2 increased rapidly as the metabolism ceased. For the aerobic growth, the pH was constant during glucose consumption and rose as succinate was consumed. In the O2-limited case, the pH dropped initially as acetate was produced by fermentation. The pH trend was reversed as succinate and eventually, acetate were consumed.
Figure 7
Figure 7
HPLC determination of carbon source levels and carbon consumption patterns during the time course of O2-limited auto-induction in E. coli B834 (DE3) transformed with T7-Luc. A, HPLC analysis of samples from different times during the fermentation. Peak identities are: a, lactose; b, glucose co-eluting with phosphate; c, galactose; d, unknown fermentation product; 5, succinate; 6, glycerol and 7, acetate. The sample from t = 0 was taken immediately after inoculation of the fermenter. The middle traces show accumulation of galactose and acetate during intermediate time points (t = 8, 19 h) and the top trace shows phosphate, galactose and acetate remained at the end of the fermentation (t = 28 h). Galactose cannot be metabolized by E. coli B834 and increased as a byproduct of lactose consumption, while acetate was a byproduct of anaerobic fermentation. B, sigmoidal curve fitting of the relationship between change in carbon source concentration and cell density. In all cases, glucose (circles) was consumed first, and followed successively by lactose (squares), glycerol (×), succinate (diamonds), and then acetate (triangles). Acetate was initially produced and later consumed as a carbon source. C, first derivative of the sigmoidal curve fits, defined to be the specific consumption for each carbon source. These series have the same markers as in B. The filled circles show luciferase expression from the T7-Luc expression plasmid as determined by luminescence assay.
Figure 8
Figure 8
The timing of lactose consumption as a consequence of LacI dosing. A, glycerol is preferentially consumed before lactose in an aerobic growth with the T5-lacI expression plasmid. This result can be contrasted with Figure 7C, where lactose is preferentially consumed before glycerol. B, specific consumption of lactose during auto-induction growth with the indicated expression plasmids. The T7-Luc expression plasmid does not supplement LacI expression. The T7-lacI-Luc and T5-lacI-Luc plasmids contain a plasmid borne copy of the lac repressor gene with a wild-type promoter and give ~20-fold increase in the level of LacI relative to T7-Luc. The T5-lacIq-Luc plasmid also contains a plasmid borne copy of the lac repressor with a lacIq promoter that increases the level of LacI by ~10-fold higher than from T7-lacI-Luc and T5-lacI-Luc. With this latter plasmid, only a small amount of lactose was consumed and culture growth was halted at a cell density of 16 (OD600 units). In contrast, the other cultures were able to fully consume the lactose and achieved a cell density of ~21.
Figure 9
Figure 9
The effect of aeration on lactose consumption with the T5-lacI-Luc expression plasmid. A, lactose consumption (open triangles) and protein expression (filled triangles) occurred at an earlier stage of growth in O2-limited cultures as compared to the aerobic cultures (lactose consumption and expression measurements represented with either open or filled squares, respectively). B, effect of the T5-lacIq expression plasmid on lactose consumption. In O2-limited cultures, all lactose was consumed by 30 h after inoculation. In the aerobic cultures, the cell density stopped increasing at 20 h and lactose was only slowly consumed thereafter.
Figure 10
Figure 10
Comparison of modeled expression levels for T5-lacI (solid line), T7-lacI (pET32, dashed line), T5-lacIq in methionine auto-induction medium (filled diamonds) and T5-lacIq in selenomethionine auto-induction medium (filled circles). This figure is a two-dimensional plane through the response surfaces of Figure 3A (T5-lacI), 3C (T5-lacIq, methionine medium), 3D (T5-lacIq, selenomethionine medium) and 3E (T7-lacI, pET32) starting from zero glycerol and lactose and ending at 1.2% (w/v) glycerol and 0.6% (w/v) lactose.
Figure 11
Figure 11
A topographical map that includes expression data for higher carbon source concentrations. Lower expression is indicated with blue hues and higher expression with yellow hues. Experimental design points are shown as black circles. The design space explored in the first, lower concentration study is surrounded by dotted lines. For this experiment, a second factorial was completed at higher concentrations of glycerol and lactose for T5-lacI-Luc with methionine media. Dashed lines surround the second factorial, which covers higher concentrations of lactose and glycerol. The contour plot shown here represents a quadratic spline fit to the experimental data, as a single low order model could not adequately model the results due to multiple curvatures. Some fine features of the quadratic spline surface contain experimental uncertainty (such as the “valley” between the two highest expression regions) that were smoothed out in the response surface models.

Similar articles

Cited by

References

    1. Zhang C, Kim SH. Overview of Structural Genomics: From Structure to Function. Curr Opin Chem Biol. 2003;7:28–32. - PubMed
    1. Terwilliger TC. Structural Genomics in North America. Nat Struct Mol Biol. 2000;7(Suppl):935–9. - PubMed
    1. Chandonia JM, Brenner SE. The Impact of Structural Genomics: Expectations and Outcomes. Science. 2006;311:347–51. - PubMed
    1. Becker KF, Metzger V, Hipp S, Hofler H. Clinical Proteomics: New Trends for Protein Microarrays. Curr Med Chem. 2006;13:1831–7. - PubMed
    1. Arcus VL, Lott JS, Johnston JM, Baker EN. The Potential Impact of Structural Genomics on Tuberculosis Drug Discovery. Drug Discovery Today. 2006;11:28–34. - PubMed

Publication types

MeSH terms