

Unusually strong binding to the DNA minor groove by a highly twisted benzimidazole diphenylether: induced fit and bound water
- PMID: 17506529
- PMCID: PMC2519038
- DOI: 10.1021/bi700288g
Unusually strong binding to the DNA minor groove by a highly twisted benzimidazole diphenylether: induced fit and bound water
Abstract
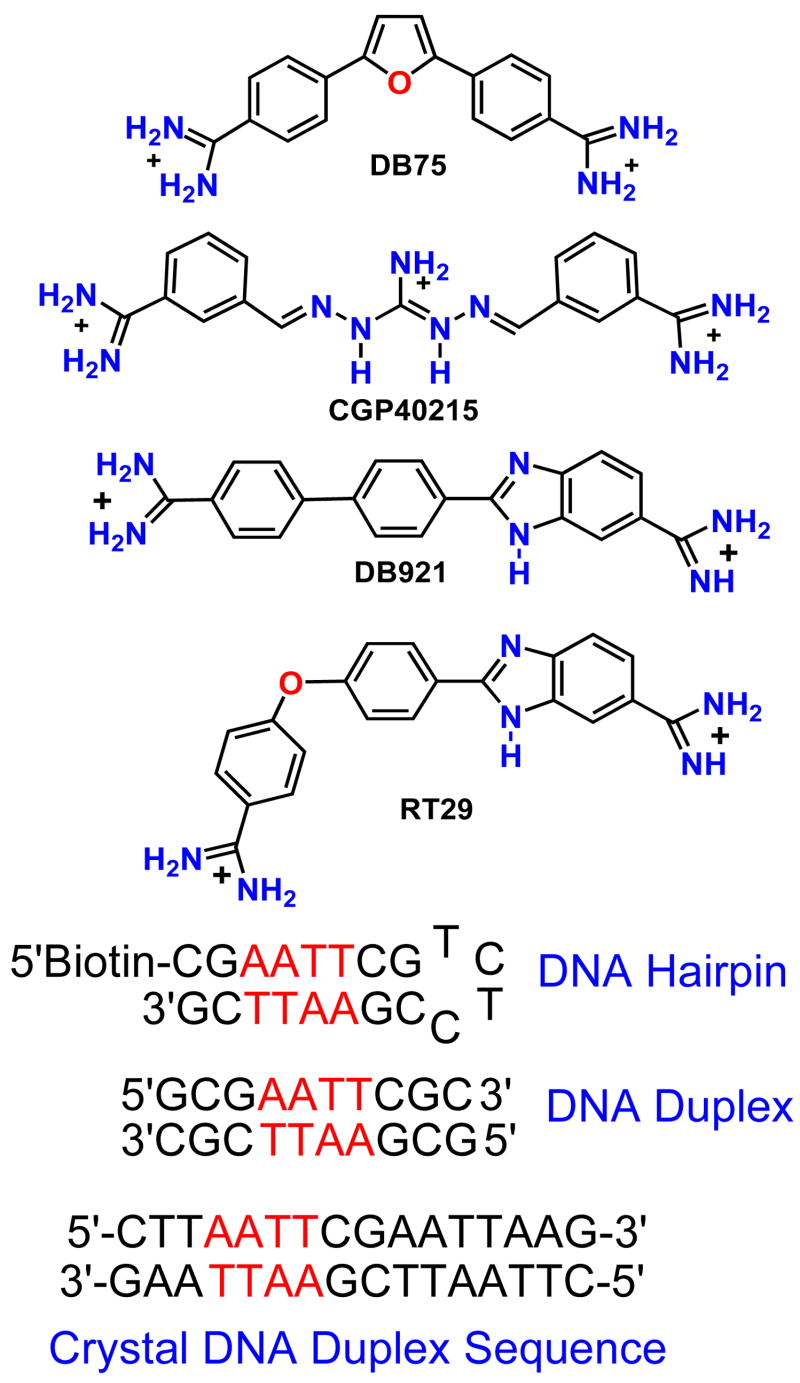
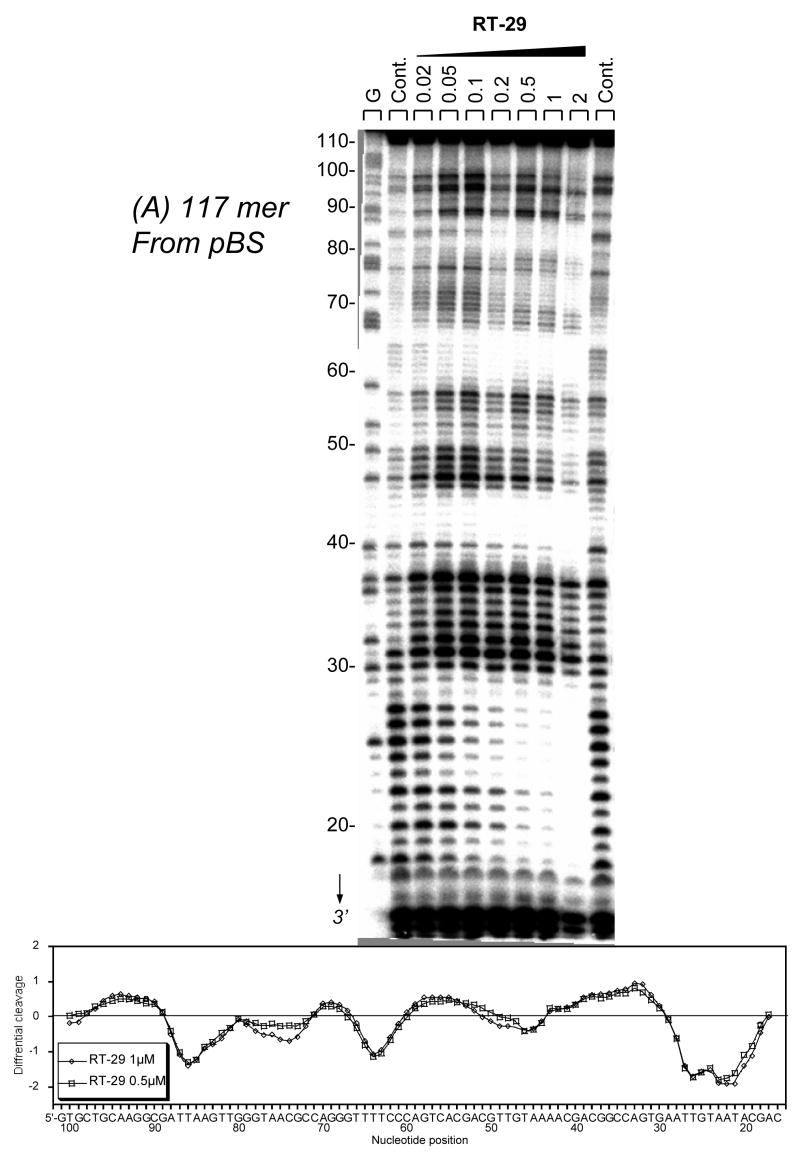
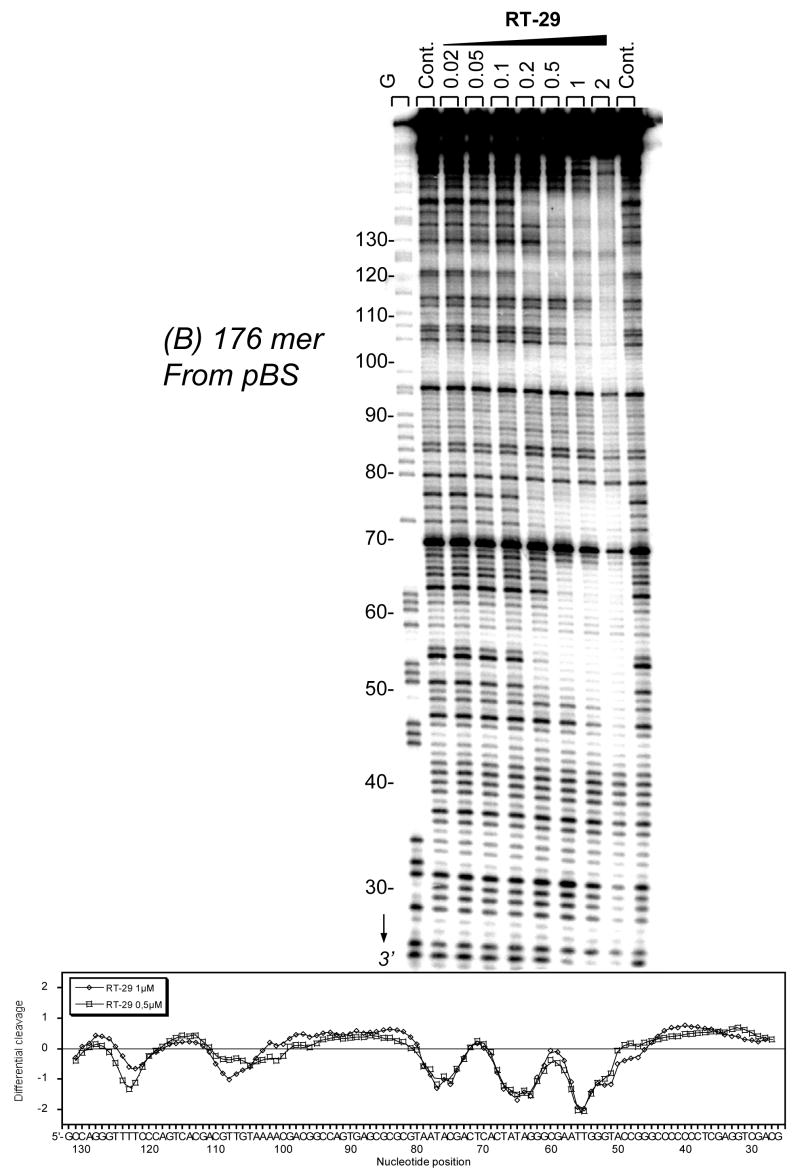
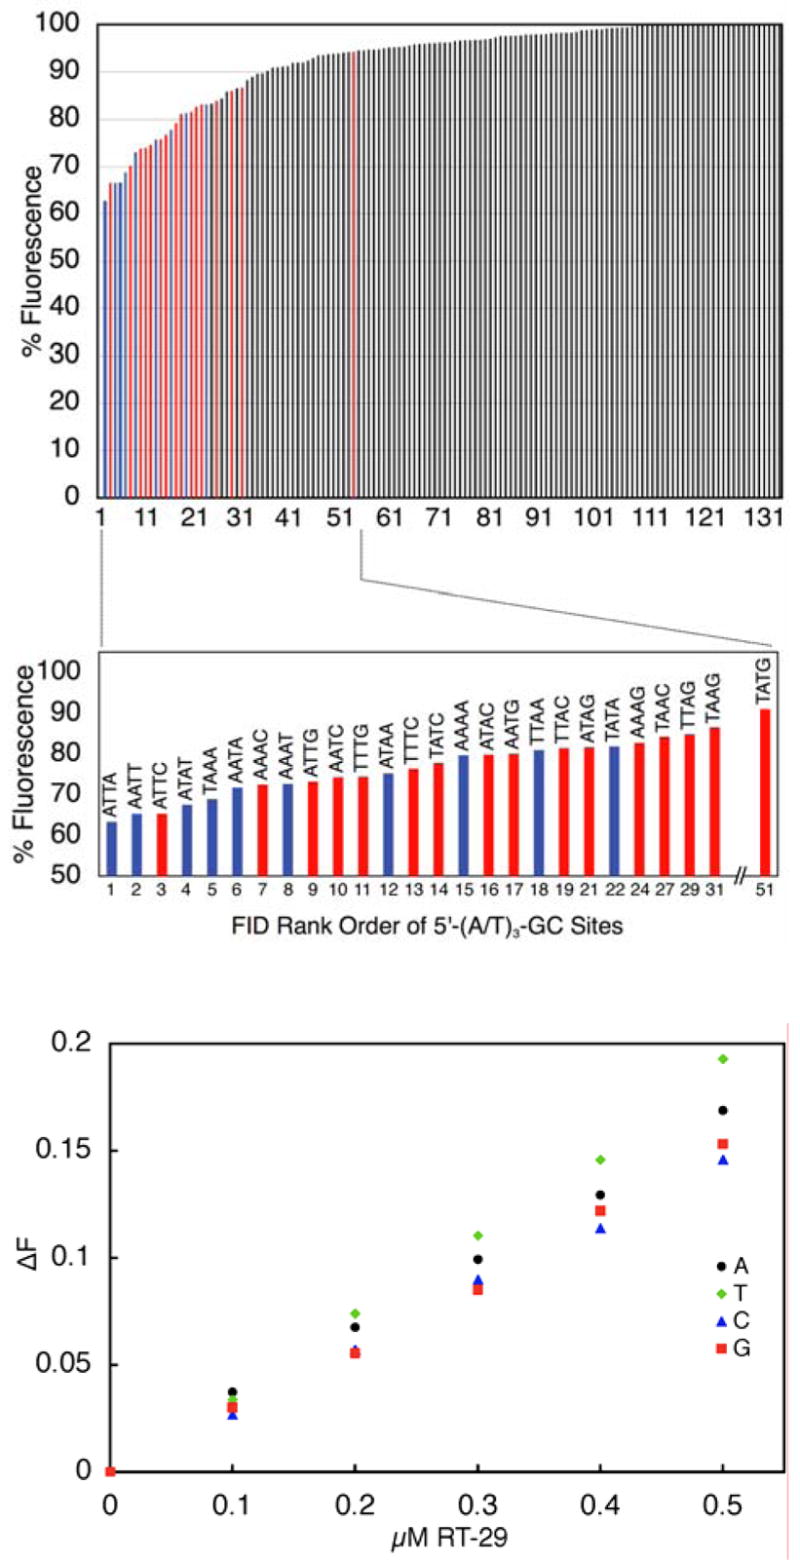
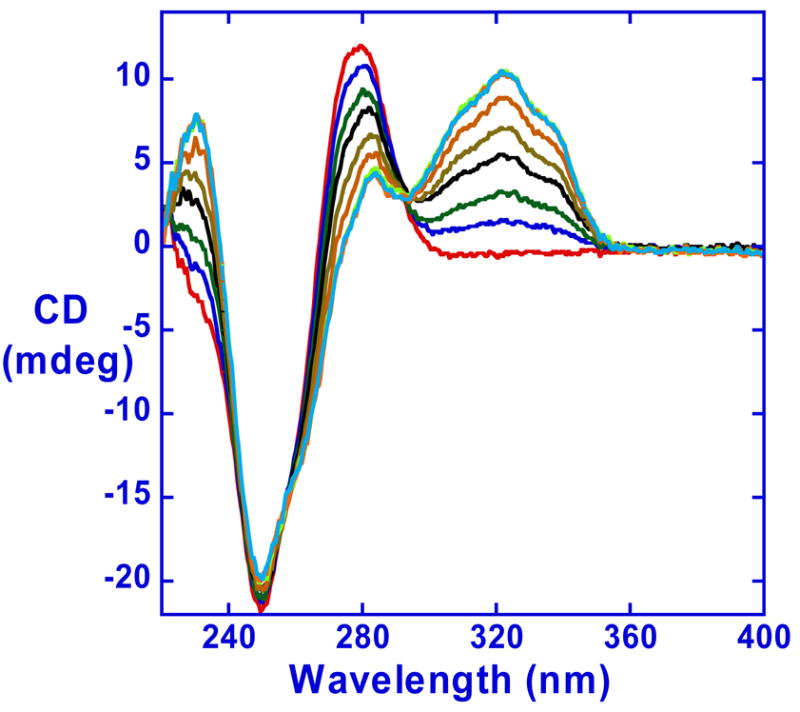
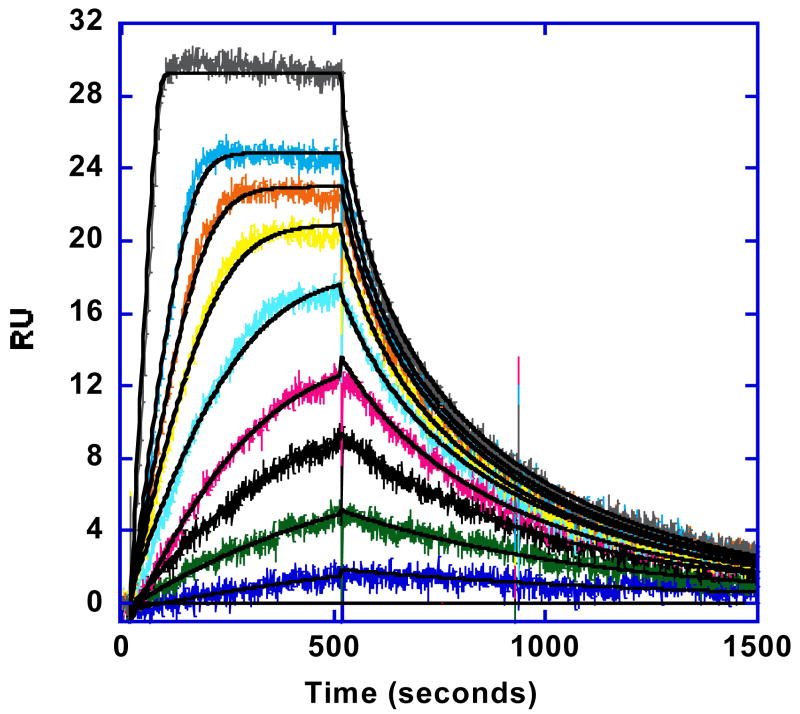
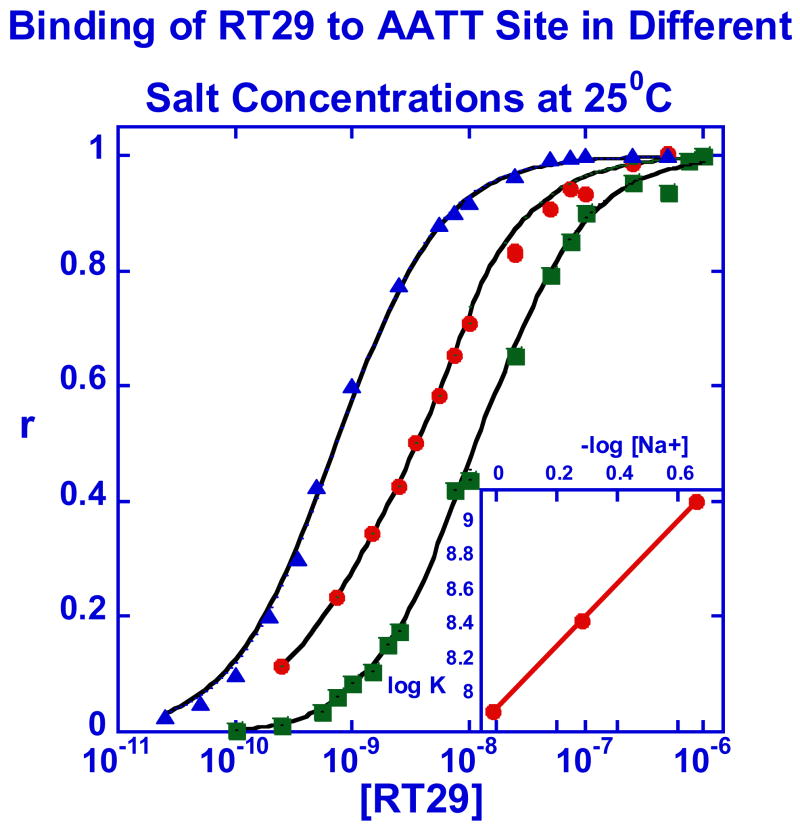
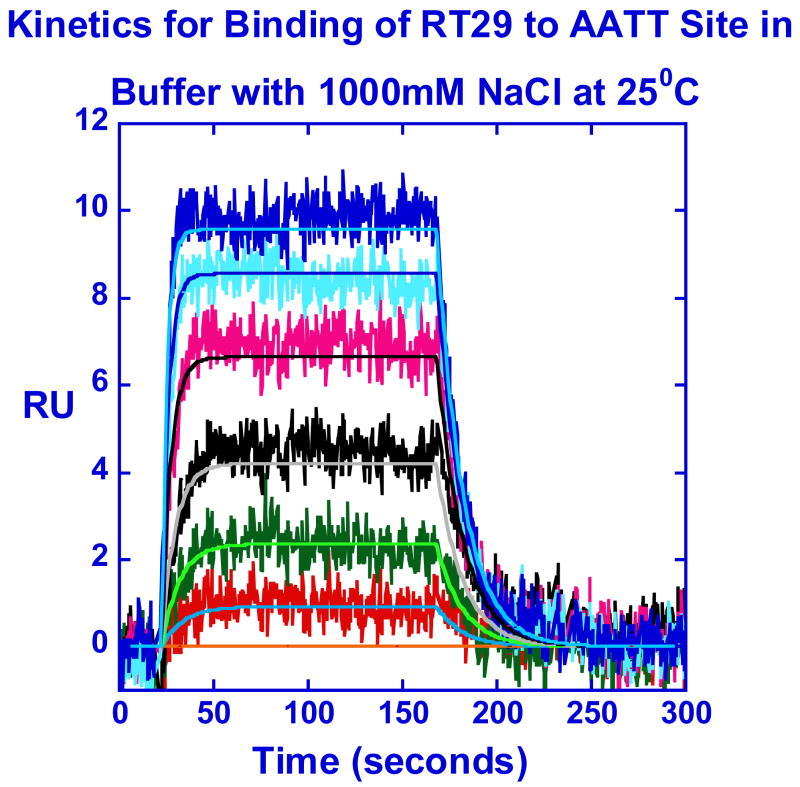
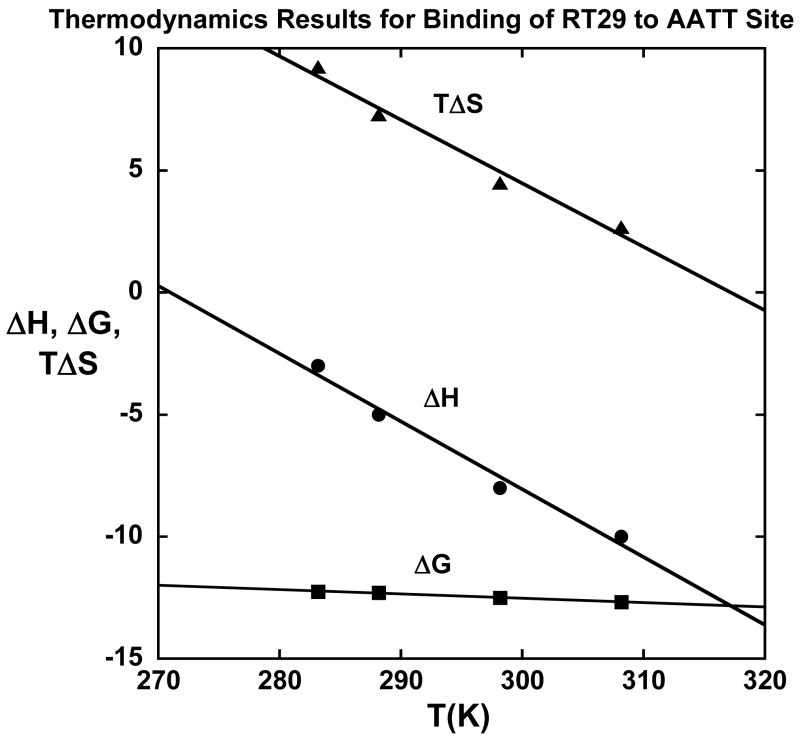
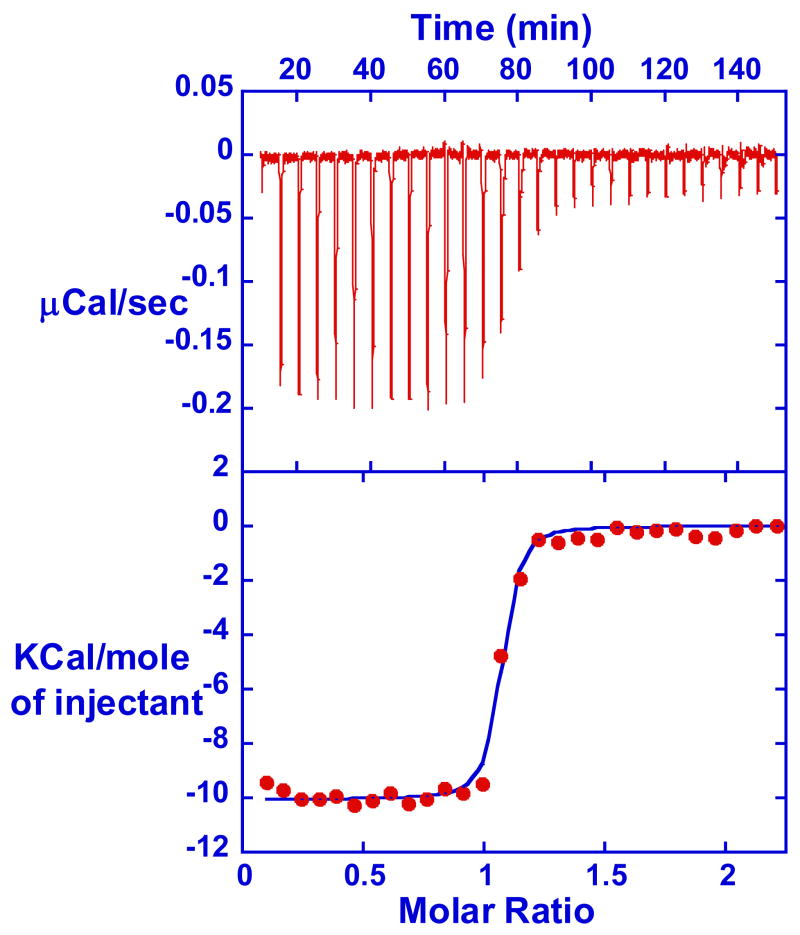
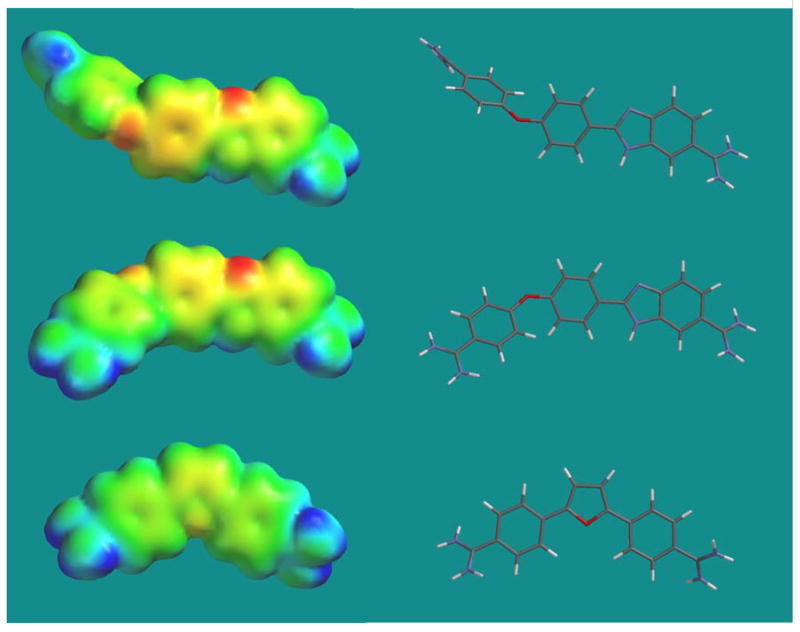
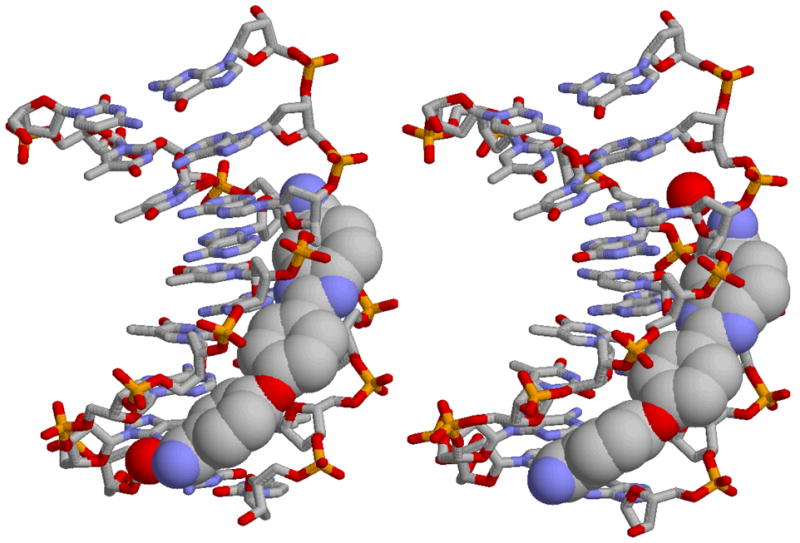
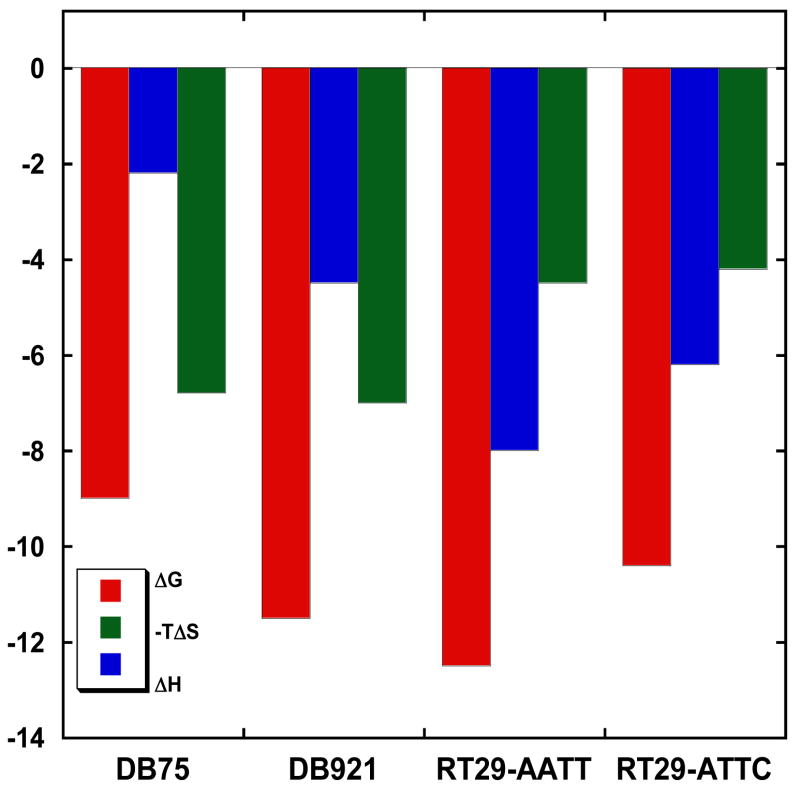
RT29 is a dicationic diamidine derivative that does not obey the classical "rules" for shape and functional group placement that are expected to result in strong binding and specific recognition of the DNA minor groove. The compound contains a benzimidazole diphenyl ether core that is flanked by the amidine cations. The diphenyl ether is highly twisted and gives the entire compound too much curvature to fit well to the shape of the minor groove. DNase I footprinting, fluorescence intercalator displacement studies, and circular dichroism spectra, however, indicate that the compound is an AT specific minor groove binding agent. Even more surprisingly, quantitative biosensor-surface plasmon resonance and isothermal titration calorimetric results indicate that the compound binds with exceptional strength to certain AT sequences in DNA with a large negative enthalpy of binding. Crystallographic results for the DNA complex of RT29 compared to calculated results for the free compound show that the compound undergoes significant conformational changes to enhance its minor groove interactions. In addition, a water molecule is incorporated directly into the complex to complete the compound-DNA interface, and it forms an essential link between the compound and base pair edges at the floor of the minor groove. The calculated DeltaCp value for complex formation is substantially less than the experimentally observed value, which supports the idea of water being an intrinsic part of the complex with a major contribution to the DeltaCp value. Both the induced fit conformational changes of the compound and the bound water are essential for strong binding to DNA by RT29.
Figures
Similar articles
-
Binding to the DNA minor groove by heterocyclic dications: from AT-specific monomers to GC recognition with dimers.Curr Protoc Nucleic Acid Chem. 2012 Dec;Chapter 8:Unit8.8. doi: 10.1002/0471142700.nc0808s51. Curr Protoc Nucleic Acid Chem. 2012. PMID: 23255206 Free PMC article. Review.
-
DNA sequence dependent monomer-dimer binding modulation of asymmetric benzimidazole derivatives.J Am Chem Soc. 2004 Jan 14;126(1):143-53. doi: 10.1021/ja030403+. J Am Chem Soc. 2004. PMID: 14709078
-
Design of DNA minor groove binding diamidines that recognize GC base pair sequences: a dimeric-hinge interaction motif.J Am Chem Soc. 2007 Nov 7;129(44):13732-43. doi: 10.1021/ja074560a. Epub 2007 Oct 13. J Am Chem Soc. 2007. PMID: 17935330 Free PMC article.
-
Out-of-shape DNA minor groove binders: induced fit interactions of heterocyclic dications with the DNA minor groove.Biochemistry. 2005 Nov 15;44(45):14701-8. doi: 10.1021/bi051791q. Biochemistry. 2005. PMID: 16274217
-
Binding to the DNA Minor Groove by Heterocyclic Dications: from AT Specific to GC Recognition Compounds.Curr Protoc. 2023 Apr;3(4):e729. doi: 10.1002/cpz1.729. Curr Protoc. 2023. PMID: 37071034 Review.
Cited by
-
Binding to the DNA minor groove by heterocyclic dications: from AT-specific monomers to GC recognition with dimers.Curr Protoc Nucleic Acid Chem. 2012 Dec;Chapter 8:Unit8.8. doi: 10.1002/0471142700.nc0808s51. Curr Protoc Nucleic Acid Chem. 2012. PMID: 23255206 Free PMC article. Review.
-
Revisiting the association of cationic groove-binding drugs to DNA using a Poisson-Boltzmann approach.Biophys J. 2010 Aug 4;99(3):879-86. doi: 10.1016/j.bpj.2010.04.066. Biophys J. 2010. PMID: 20682266 Free PMC article.
-
Crystal structures of 'ALternative Isoinformational ENgineered' DNA in B-form.Philos Trans R Soc Lond B Biol Sci. 2023 Feb 27;378(1871):20220028. doi: 10.1098/rstb.2022.0028. Epub 2023 Jan 11. Philos Trans R Soc Lond B Biol Sci. 2023. PMID: 36633282 Free PMC article.
-
DNA-facilitated target search by nucleoproteins: Extension of a biosensor-surface plasmon resonance method.Anal Biochem. 2021 Sep 15;629:114298. doi: 10.1016/j.ab.2021.114298. Epub 2021 Jul 10. Anal Biochem. 2021. PMID: 34252439 Free PMC article.
-
DNA Targeting as a Likely Mechanism Underlying the Antibacterial Activity of Synthetic Bis-Indole Antibiotics.Antimicrob Agents Chemother. 2016 Nov 21;60(12):7067-7076. doi: 10.1128/AAC.00309-16. Print 2016 Dec. Antimicrob Agents Chemother. 2016. PMID: 27620482 Free PMC article.
References
-
- Tidwell RR, Boykin DW. Dicationic DNA minor-groove binders as antimicrobial agents. In: Demeunynck M, Bailly C, Wilson WD, editors. DNA and RNA Binders: From Small Molecules to Drugs. WILEY-VCH; Weinheim: 2003. pp. 414–460.
-
- Wilson WD, Nguyen B, Tanious FA, Mathis A, Hall JE, Stephens CE, Boykin DW. Dications that target the DNA minor groove: compound design and preparation, DNA interactions, cellular distribution and biological activity. Curr Med Chem Anti-Canc Agents. 2005;5:389–408. - PubMed
-
- Neidle S. DNA minor-groove recognition by small molecules. Nat Prod Rep. 2001:291–309. - PubMed
-
- Dervan PB, Edelson BS. Recognition of the DNA minor groove by pyrrole-imidazole polyamides. Curr Opin Struct Biol. 2003:284–299. - PubMed
Publication types
MeSH terms
Substances
Grants and funding
LinkOut - more resources
Full Text Sources
