

CgNa, a type I toxin from the giant Caribbean sea anemone Condylactis gigantea shows structural similarities to both type I and II toxins, as well as distinctive structural and functional properties(1)
- PMID: 17506725
- PMCID: PMC1948996
- DOI: 10.1042/BJ20070130
CgNa, a type I toxin from the giant Caribbean sea anemone Condylactis gigantea shows structural similarities to both type I and II toxins, as well as distinctive structural and functional properties(1)
Abstract
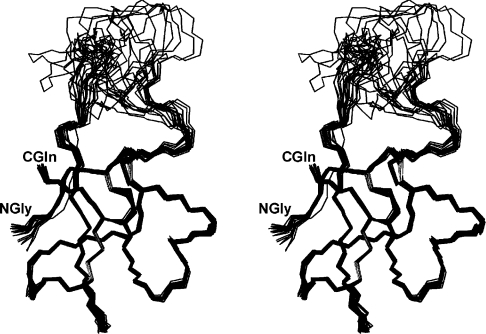
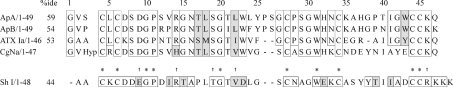
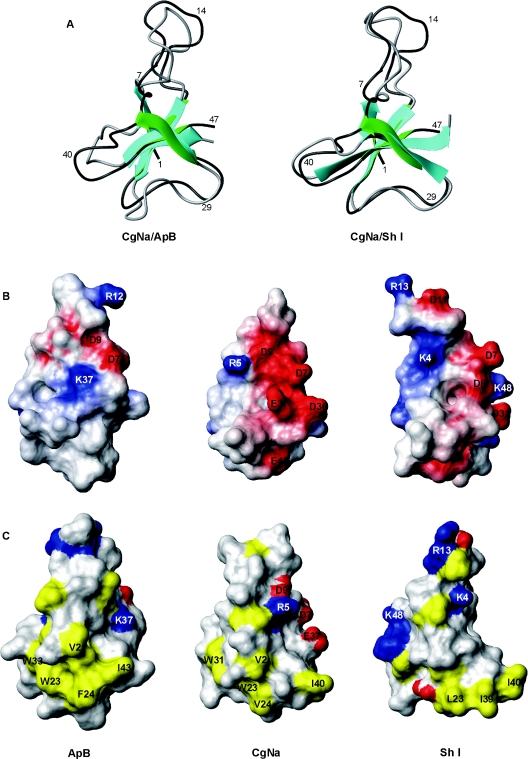
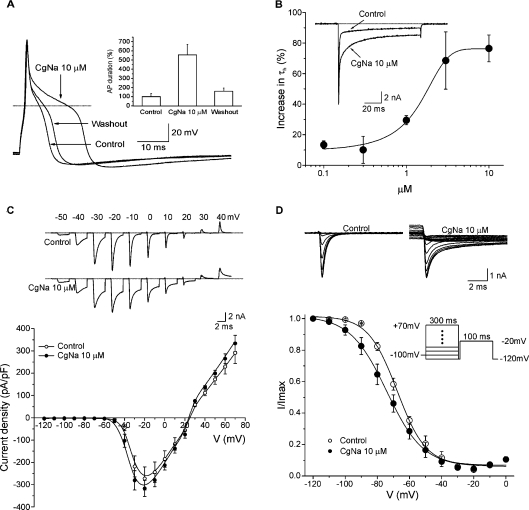
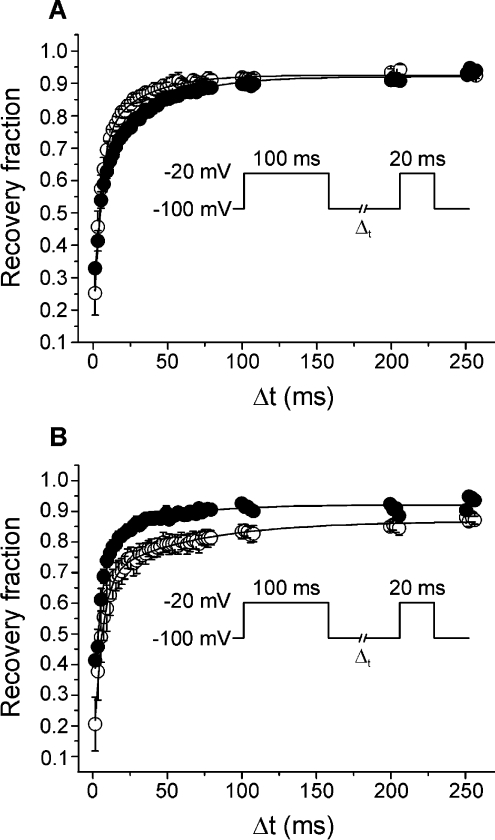
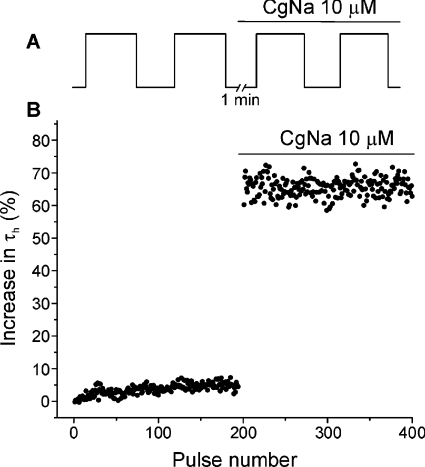
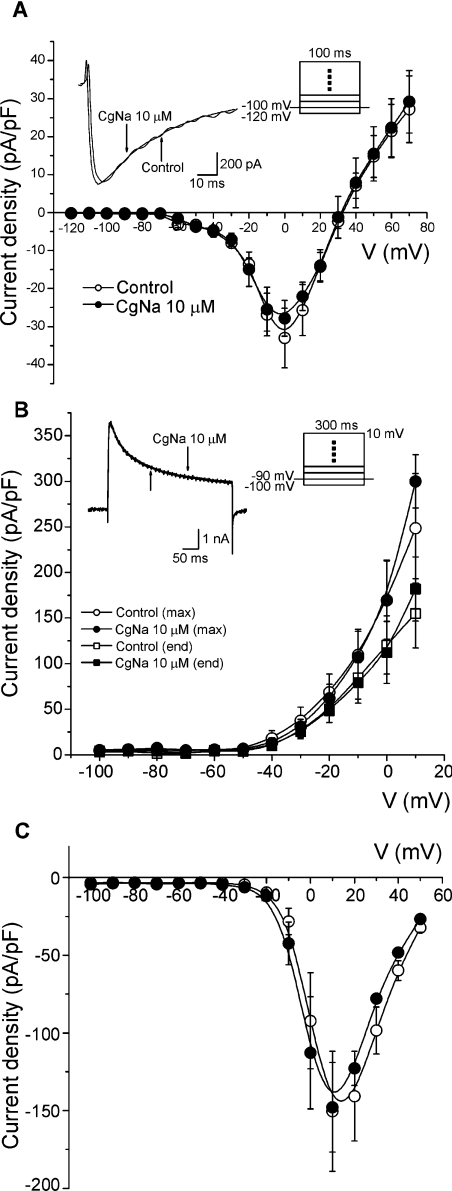
CgNa (Condylactis gigantea neurotoxin) is a 47-amino-acid- residue toxin from the giant Caribbean sea anemone Condylactis gigantea. The structure of CgNa, which was solved by 1H-NMR spectroscopy, is somewhat atypical and displays significant homology with both type I and II anemone toxins. CgNa also displays a considerable number of exceptions to the canonical structural elements that are thought to be essential for the activity of this group of toxins. Furthermore, unique residues in CgNa define a characteristic structure with strong negatively charged surface patches. These patches disrupt a surface-exposed cluster of hydrophobic residues present in all anemone-derived toxins described to date. A thorough characterization by patch-clamp analysis using rat DRG (dorsal root ganglion) neurons indicated that CgNa preferentially binds to TTX-S (tetrodotoxin-sensitive) voltage-gated sodium channels in the resting state. This association increased the inactivation time constant and the rate of recovery from inactivation, inducing a significant shift in the steady state of inactivation curve to the left. The specific structural features of CgNa may explain its weaker inhibitory capacity when compared with the other type I and II anemone toxins.
Figures
Similar articles
-
Phyla- and Subtype-Selectivity of CgNa, a Na Channel Toxin from the Venom of the Giant Caribbean Sea Anemone Condylactis Gigantea.Front Pharmacol. 2010 Nov 23;1:133. doi: 10.3389/fphar.2010.00133. eCollection 2010. Front Pharmacol. 2010. PMID: 21833172 Free PMC article.
-
A new toxin from the sea anemone Condylactis gigantea with effect on sodium channel inactivation.Toxicon. 2006 Aug;48(2):211-20. doi: 10.1016/j.toxicon.2006.05.001. Epub 2006 May 19. Toxicon. 2006. PMID: 16814340
-
The sea anemone Bunodosoma caissarum toxin BcIII modulates the sodium current kinetics of rat dorsal root ganglia neurons and is displaced in a voltage-dependent manner.Peptides. 2010 Mar;31(3):412-8. doi: 10.1016/j.peptides.2009.12.005. Epub 2009 Dec 16. Peptides. 2010. PMID: 20015459
-
Site-3 sea anemone toxins: molecular probes of gating mechanisms in voltage-dependent sodium channels.Toxicon. 2007 Feb;49(2):159-70. doi: 10.1016/j.toxicon.2006.09.020. Epub 2006 Sep 28. Toxicon. 2007. PMID: 17095031 Review.
-
Sea anemone venom as a source of insecticidal peptides acting on voltage-gated Na+ channels.Toxicon. 2007 Mar 15;49(4):550-60. doi: 10.1016/j.toxicon.2006.11.029. Epub 2006 Dec 5. Toxicon. 2007. PMID: 17224168 Free PMC article. Review.
Cited by
-
New Disulfide-Stabilized Fold Provides Sea Anemone Peptide to Exhibit Both Antimicrobial and TRPA1 Potentiating Properties.Toxins (Basel). 2017 Apr 29;9(5):154. doi: 10.3390/toxins9050154. Toxins (Basel). 2017. PMID: 28468269 Free PMC article.
-
New Insights into the Type II Toxins from the Sea Anemone Heteractis crispa.Toxins (Basel). 2020 Jan 10;12(1):44. doi: 10.3390/toxins12010044. Toxins (Basel). 2020. PMID: 31936885 Free PMC article.
-
Phyla- and Subtype-Selectivity of CgNa, a Na Channel Toxin from the Venom of the Giant Caribbean Sea Anemone Condylactis Gigantea.Front Pharmacol. 2010 Nov 23;1:133. doi: 10.3389/fphar.2010.00133. eCollection 2010. Front Pharmacol. 2010. PMID: 21833172 Free PMC article.
-
The Invasive Anemone Condylactis sp. of the Coral Reef as a Source of Sulfur- and Nitrogen-Containing Metabolites and Cytotoxic 5,8-Epidioxy Steroids.Metabolites. 2023 Mar 7;13(3):392. doi: 10.3390/metabo13030392. Metabolites. 2023. PMID: 36984832 Free PMC article.
-
Sea anemone toxins affecting voltage-gated sodium channels--molecular and evolutionary features.Toxicon. 2009 Dec 15;54(8):1089-101. doi: 10.1016/j.toxicon.2009.02.028. Epub 2009 Mar 5. Toxicon. 2009. PMID: 19268682 Free PMC article. Review.
References
-
- Aneiros A., Garateix A. Bioactive peptides from marine sources: pharmacological properties and isolation procedures. J. Chromatogr. B. 2004;803:41–53. - PubMed
-
- Norton T. R. Cardiotonic polypeptides from Anthopleura xanthogrammica (Brandt) and A. elegantissima (Brandt) Fed. Proc. 1981;40:21–25. - PubMed
-
- Loret E. P., del Valle R. M., Mansuelle P., Sampieri F., Rochat H. Positively charged amino acid residues located similarly in sea anemone and scorpion toxins. J. Biol. Chem. 1994;269:16785–16788. - PubMed
-
- Norton R. S. Structure and structure–function relationships of sea anemone proteins that interact with the Na+ channel. Toxicon. 1991;29:1051–1084. - PubMed
-
- Rogers J. C., Qu Y., Tanada T. N., Scheuer T., Catterall W. A. Molecular determinants of high affinity binding of α-scorpion toxin and sea anemone toxin in the S3–S4 extracellular loop in domain IV of the Na+ channel α subunit. J. Biol. Chem. 1996;271:15950–15962. - PubMed
Publication types
MeSH terms
Substances
Associated data
- Actions
LinkOut - more resources
Full Text Sources