. 2007 Sep;64(3):335-45.
doi: 10.1111/j.1365-2125.2007.02926.x. Epub 2007 May 15.

A pharmacokinetic model for L-carnitine in patients receiving haemodialysis

Affiliations

A pharmacokinetic model for L-carnitine in patients receiving haemodialysis

Gianfranco Fornasini et al. Br J Clin Pharmacol. 2007 Sep.

Abstract

Aims: Patients requiring chronic haemodialysis may develop a secondary carnitine deficiency through dialytic loss of L-carnitine. A previous report has described the plasma concentrations of L-carnitine in 12 such patients under baseline conditions and after L-carnitine administration (20 mg kg(-1)). A three-compartment pharmacokinetic model was developed to describe these data to make inferences about carnitine supplementation in these patients.

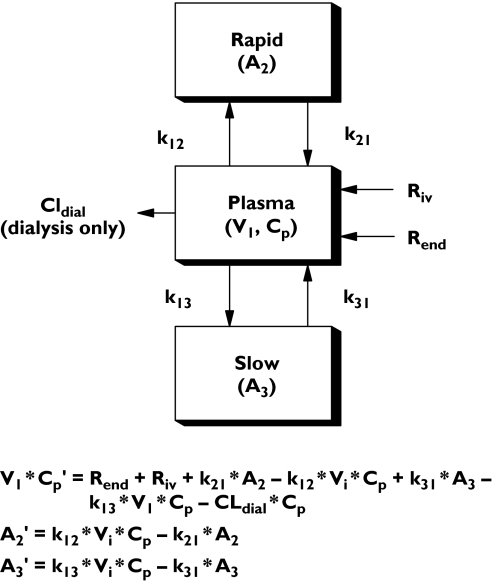
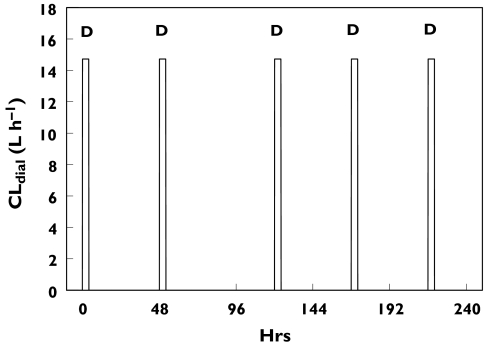
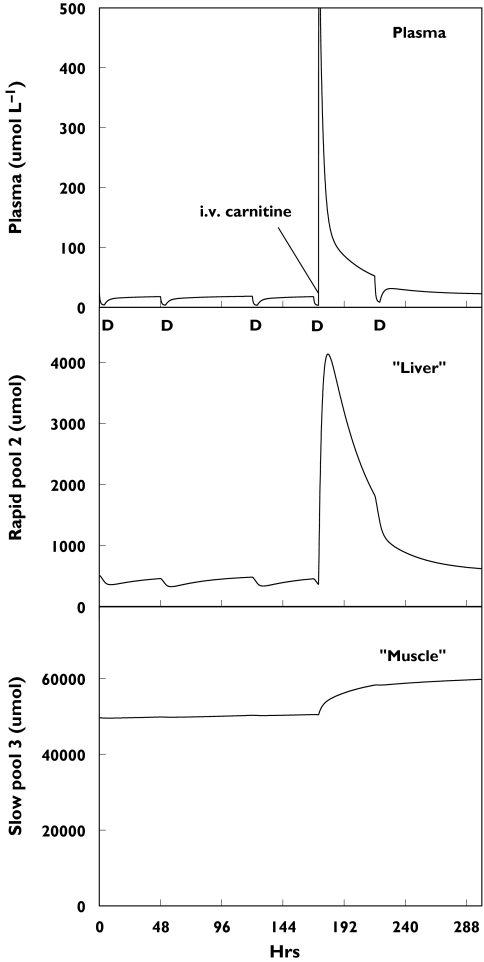
Methods: L-carnitine removal was mediated solely by intermittent haemodialysis, which was incorporated into the model as an experimentally derived dialysis clearance value that was linked to an on-off pulse function. Data were described by a model with a central compartment linked to 'fast'- and 'slow'-equilibrating peripheral compartments.

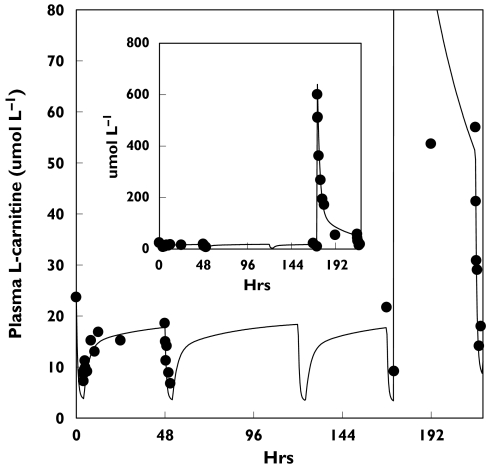
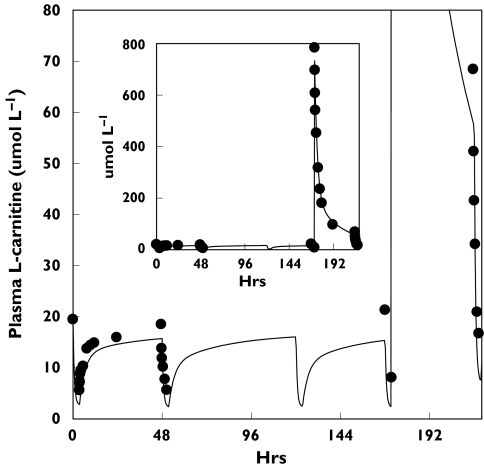
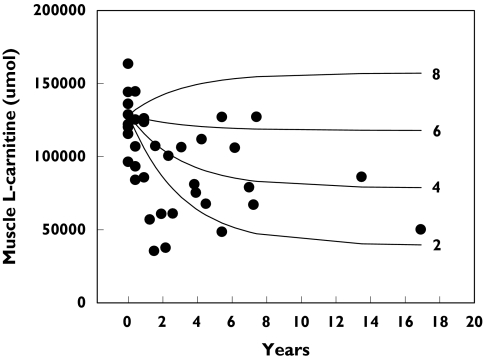
Results: The model adequately described the changing plasma concentrations of endogenous L-carnitine in individual haemodialysis patients. Based on pooled data (mean +/- SD; n = 12), the volume of the central compartment was 10.09 +/- 0.72 l and the transfer rate constants into and out of the slowly equilibrating pool were 0.100 +/- 0.018 h(-1) and 0.00014 +/- 0.00016 h(-1), respectively. The turnover time of L-carnitine in the slow pool (which was assumed to represent muscle) was approximately 300 days. The model was in general agreement with separate data on the measured loss of carnitine from muscle in dialysis patients.

Conclusions: Haemodialysis causes rapid reductions in plasma L-carnitine concentrations with each dialysis session. Plasma concentrations are restored between sessions by redistribution from peripheral compartments. However, during chronic haemodialysis, the ongoing dialytic loss of L-carnitine may lead to a slow depletion of the compound, contributing to a possible secondary deficiency.


Figures

Figure 1
Figure 1
The pharmacokinetic model used to describe L-carnitine in end-stage renal disease patients undergoing intermittent haemodialysis. V1 is the volume of the central compartment with concentration Cp. A2 and A3 are the amounts in the peripheral compartments, as governed by the rate constants k12, k21, and k13 and k31, respectively. CLDIAL is the clearance that occurred intermittently (only during the dialysis periods). Riv is the intermittent rate of administration of exogenous carnitine corresponding to intravenous doses; Rend is the constant rate of endogenous carnitine input from dietary and metabolic sources. The rapidly and slowly equilibrating peripheral compartments were nominally attributed to liver and muscle, respectively. Cp′, A2′ and A3′ are notation for derivatives with respect to time
Figure 2
Figure 2
An example of the output of the algorithm used for intermittent clearance. In this instance, the algorithm described the haemodialysis for patient 5, who received five periods of dialysis (CLDIAL, 14.7 l h−1 for 4 h) during the modelled period. Each period is marked with the symbol ‘D’
Figure 3
Figure 3
Plasma concentration vs. time profiles for L-carnitine in a representative end-stage renal disease patient (patient 5) under baseline conditions and after a single intravenous dose of L-carnitine (20 mg kg−1). The symbols represent measured concentrations, and the continuous line represents the concentrations predicted by the fitted model
Figure 4
Figure 4
Plasma concentration vs. time profiles for L-carnitine in 12 end-stage renal disease patients under baseline conditions and after a single intravenous dose of L-carnitine (20 mg kg−1). The symbols represent pooled concentrations from the 12 patients, and the continuous line represents the concentrations predicted by the fitted model
Figure 5
Figure 5
Simulated amounts of L-carnitine in the three compartments of the pharmacokinetic model in patient 5 undergoing intermittent haemodialysis three times per week
Figure 6
Figure 6
The predicted and observed muscle contents of L-carntine when an individual with normal carnitine pools is placed on dialysis. The symbols show the muscle carnitine contents estimated from measures of muscle carnitine concentration in dialysis patients before and during continuous dialysis for up to 17 years. The lines show the muscle content predicted using the model with initially normal carnitine pools and with parameter values and dialysis conditions set at average values and with endogenous production set at either 2, 4, 6 or 8 µmol h−1. The extent of depletion of the muscle carnitine depended on the balance between the loss of carnitine via dialysis and the rate of inputs (from diet, endogenous synthesis and supplement)

Similar articles

Cited by

References

    1. Bremer J. Carnitine – metabolism and functions. Physiol Rev. 1983;63:1420–80. - PubMed
    1. Vaz FM, Wanders RJA. Carnitine biosynthesis in mammals. Biochem J. 2000;361:417–29. - PMC - PubMed
    1. Rebouche CJ. Kinetics, pharmacokinetics, and regulation of L-carnitine and acetyl-L-carnitine metabolism. Ann NY Acad Sci. 2004;1033:30–41. - PubMed
    1. Evans AM, Fornasini G. Pharmacokinetics of L-carnitine. Clin Pharmacokinet. 2003;42:941–67. - PubMed
    1. Ahmad S. L-carnitine in dialysis patients. Semin Dialysis. 2001;14:209–17. - PubMed

Publication types