. 2007 May 16:8:156.
doi: 10.1186/1471-2105-8-156.

The Deuterator: software for the determination of backbone amide deuterium levels from H/D exchange MS data

Affiliations

The Deuterator: software for the determination of backbone amide deuterium levels from H/D exchange MS data

B D Pascal et al. BMC Bioinformatics. .

Abstract

Background: The combination of mass spectrometry and solution phase amide hydrogen/deuterium exchange (H/D exchange) experiments is an effective method for characterizing protein dynamics, and protein-protein or protein-ligand interactions. Despite methodological advancements and improvements in instrumentation and automation, data analysis and display remains a tedious process. The factors that contribute to this bottleneck are the large number of data points produced in a typical experiment, each requiring manual curation and validation, and then calculation of the level of backbone amide exchange. Tools have become available that address some of these issues, but lack sufficient integration, functionality, and accessibility required to address the needs of the H/D exchange community. To date there is no software for the analysis of H/D exchange data that comprehensively addresses these issues.

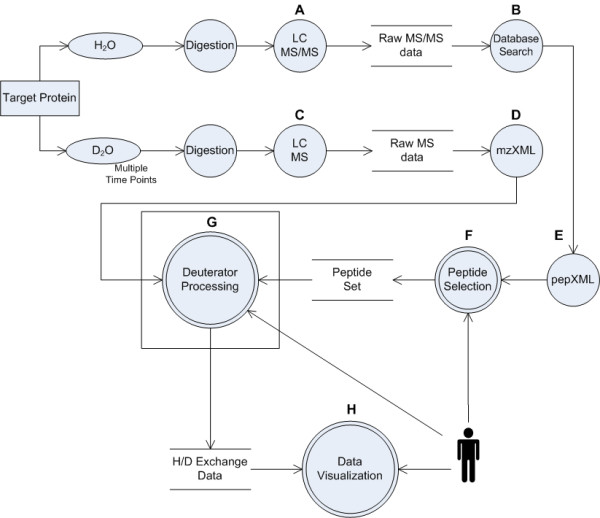
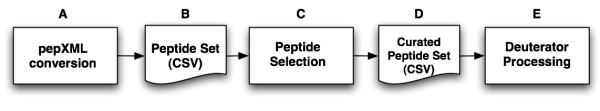
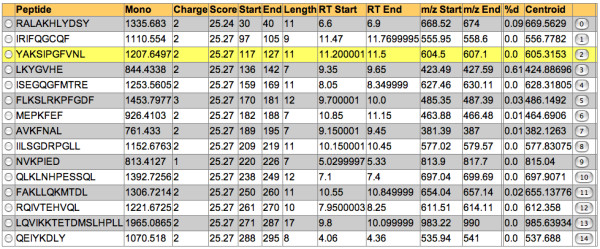
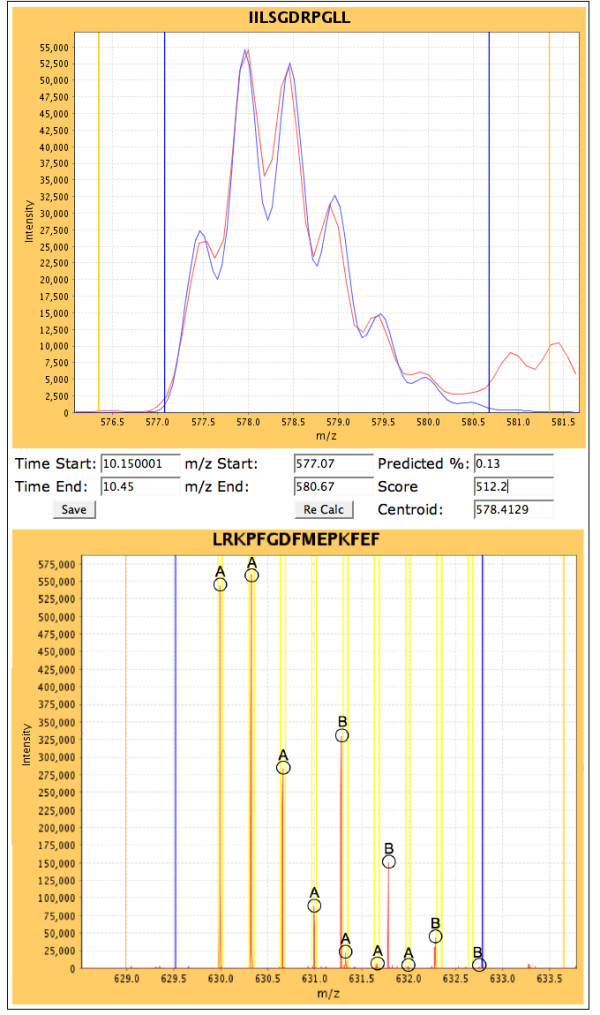
Results: We have developed an integrated software system for the automated analysis and representation of H/D exchange data that has been titled "The Deuterator". Novel approaches have been implemented that enable high throughput analysis, automated determination of deuterium incorporation, and deconvolution of overlapping peptides. This has been achieved by using methods involving iterative theoretical envelope fitting, and consideration of peak data within expected m/z ranges. Existing common file formats have been leveraged to allow compatibility with the output from the myriad of MS instrument platforms and peptide sequence database search engines.A web-based interface is used to integrate the components of The Deuterator that are able to analyze and present mass spectral data from instruments with varying resolving powers. The results, if necessary, can then be confirmed, adjusted, re-calculated and saved. Additional tools synchronize the curated calculation parameters with replicate time points, increasing throughput. Saved results can then be used to plot deuterium buildup curves and 3D structural overlays. The system has been used successfully in a production environment for over one year and is freely available as a web tool at the project home page http://deuterator.florida.scripps.edu.

Conclusion: The automated calculation and presentation of H/D exchange data in a user interface enables scientists to organize and analyze data efficiently. Integration of the different components of The Deuterator coupled with the flexibility of common data file formats allow this system to be accessible to the broadening H/D exchange community.


Figures

Figure 1
Figure 1
Data Workflow. A. The protein of interest is digested with an enzyme and the resulting peptides are analyzed by LC MS. B. Peptide identity is then established with database search tools such as Sequest. C. The protein is incubated with D2O at multiple time points, digested with an enzyme and the resulting peptides are analyzed by LC MS. D. Resulting raw files are converted to mzXML. E. Search results are converted into PepXML. F. User selects the peptides of interest from the search results to create the peptide set. G. Core Deuterator processing and interactive tools for H/D/exchange data curation. H. Data visualization components such as graphs in Microsoft Excel and 3D structure overlays in PyMol.
Figure 2
Figure 2
Peptide Set Process. A. The search results pepXML file is converted to CSV format to facilitate editing. B. The raw peptide set in CSV format. C. The user selects the peptides of interest. D. The final curated peptide set in CSV format. E. Deuterator processing.
Figure 3
Figure 3
Data Grid. Relevant H/D exchange data for each peptide are presented in the grid view. Selection of the peptide loads the associated data into the main spectral and extracted ion viewers.
Figure 4
Figure 4
Main Spectral Viewer. Top. Co-added low-resolution spectral data within the selected retention time range is presented in the viewer. The theoretical isotopic envelope (blue) is overlaid on the observed data (red), showing the best-fit envelope used for calculation of deuterium content. Bottom. Co-added high-resolution spectral data within the selected retention time range is presented in the viewer. Correct peak data is extracted from calculated sub-ranges only, displayed as yellow bars. Correct peaks are extracted from the spectral data, enabling more accurate centroid measurements in areas with poor signal to noise ratios or overlapping peptides. 'A' Peaks belong to the peptide of interest and all reside within the sub ranges. 'B' peaks belong to another peptide (+1), which will be disregarded from centroid calculations.
Figure 5
Figure 5
Extracted ion chromatogram. The averaged ion intensities for a centroid mass ± 0.5 (Da) are displayed across all scans allowing the user to graphically determine the retention time range that will produce the best data results. In the case above, the co-added data may yield an isotopic profile with a higher signal-to-noise ratio if the retention time start and end positions were reduced slightly.
Figure 6
Figure 6
Iterative Theoretical Isotope Approach. 1. The natural isotopic envelope is calculated for the peptide at 0% deuterium content and scaled to the highest observed intensity within its m/z range. The chi-square fit score is noted. 2. The process is repeated in 1% increments to 100%. 3. The best (lowest) score is used in the results. The panels above show some of the iterations at increasing levels of deuterium incorporation. A = 0%, B = 10%, C = 25%, D = 43%, E = 65%, F = 90%. The best chi-square score was for panel D at 43% deuterium incorporation.
Figure 7
Figure 7
Deuterium vs. Log Time (s). Differential H/D exchange data can be exported and plotted as %D vs. Log time (s) plots. Here we show data from a differential H/D exchange experiment to investigate perturbation in H/D exchange rates upon binding of a ligand (rosiglitazone) to PPARγ. Black line = PPARγ, Grey line = PPARγ + ligand. Top. The region between residues 279 and 287 exhibits a significant slow down in exchange rate following ligand binding. Bottom. Exchange rates for the region spanning residues 421–431 show no change. Statistical summary from a 2-way ANOVA between apo and ligand bound data; *** = P < 0.001, ns = not significant.
Figure 8
Figure 8
3D Overlay. H/D exchange data can be plotted over the three-dimensional protein structure. Here we show the % difference in H/D exchange rate for PPARγ following binding of rosiglitazone plotted over 2PRG.pdb (ligand is represented as a surface rendering). The magnitude of any change in H/D exchange rate upon ligand binding is plotted according to the color key.

Similar articles

Cited by

References

    1. Engen JR, Smith DL. Investigating protein structure and dynamics by hydrogen exchange MS. Analytical Chemistry. 2001;73:256A–265A. - PubMed
    1. Englander SW. Hydrogen Exchange Mass Spectrometry: A Historical Perspective. Journal of the American Society for Mass Spectrometry. 2006;17:1481–1489. doi: 10.1016/j.jasms.2006.06.006. - DOI - PMC - PubMed
    1. Buijs J, Costa Vera C, Ayala E, Steensma E, Hakansson P, Oscarsson S. Conformational stability of adsorbed insulin studied with mass spectrometry and hydrogen exchange. Analytical Chemistry. 1999;71:3219–3225. doi: 10.1021/ac9809433. - DOI - PubMed
    1. Mandell JG, Falick AM, Komives EA. Measurement of Amide Hydrogen Exchange by MALDI-TOF Mass Spectrometry. Analytical Chemistry. 1998;70:3987 –33995. doi: 10.1021/ac980553g. - DOI - PubMed
    1. Chalmers MJ, Busby SA, Pascal BD, He Y, Hendrickson CL, Marshall AG, Griffin PR. Probing protein ligand interactions by automated hydrogen/deuterium exchange mass spectrometry. Analytical Chemistry. 2006;78:1005–1014. doi: 10.1021/ac051294f. - DOI - PubMed

Publication types

MeSH terms

LinkOut - more resources