. 2007 May 16:7:47.
doi: 10.1186/1471-213X-7-47.

A mechanism for the sharp transition of morphogen gradient interpretation in Xenopus

Affiliations

A mechanism for the sharp transition of morphogen gradient interpretation in Xenopus

Yasushi Saka et al. BMC Dev Biol. .

Abstract

Background: One way in which positional information is established during embryonic development is through the graded distribution of diffusible morphogens. Unfortunately, little is known about how cells interpret different concentrations of morphogen to activate different genes or how thresholds are generated in a morphogen gradient.

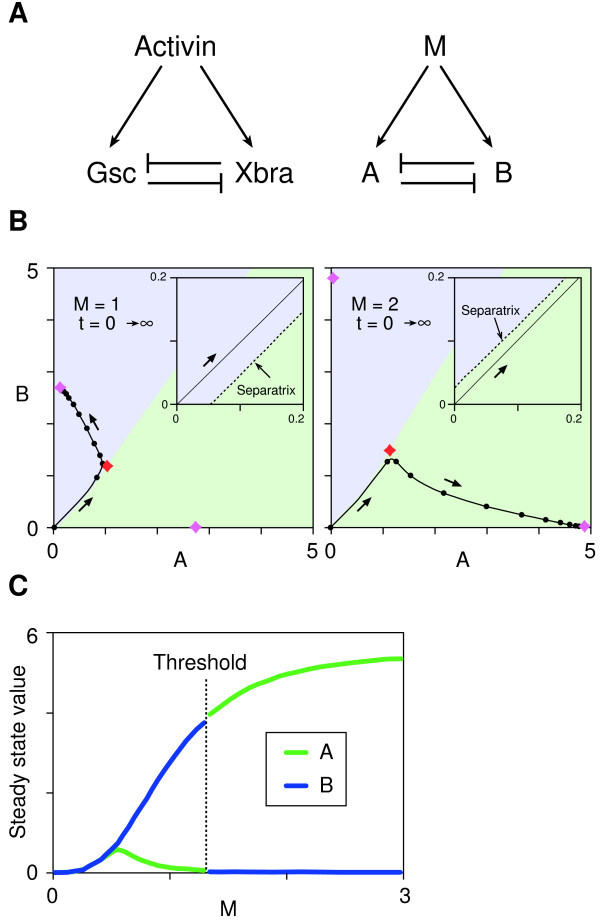
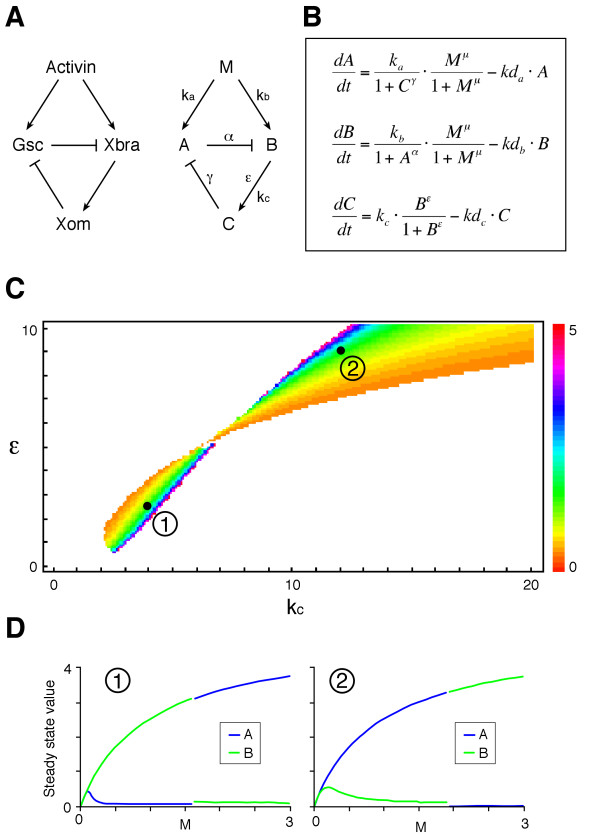
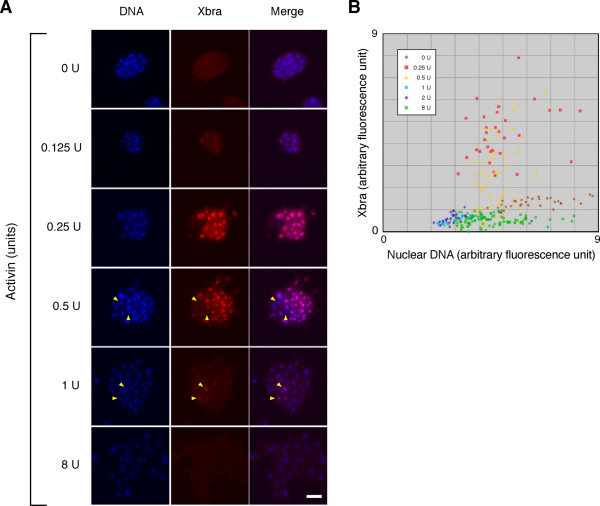
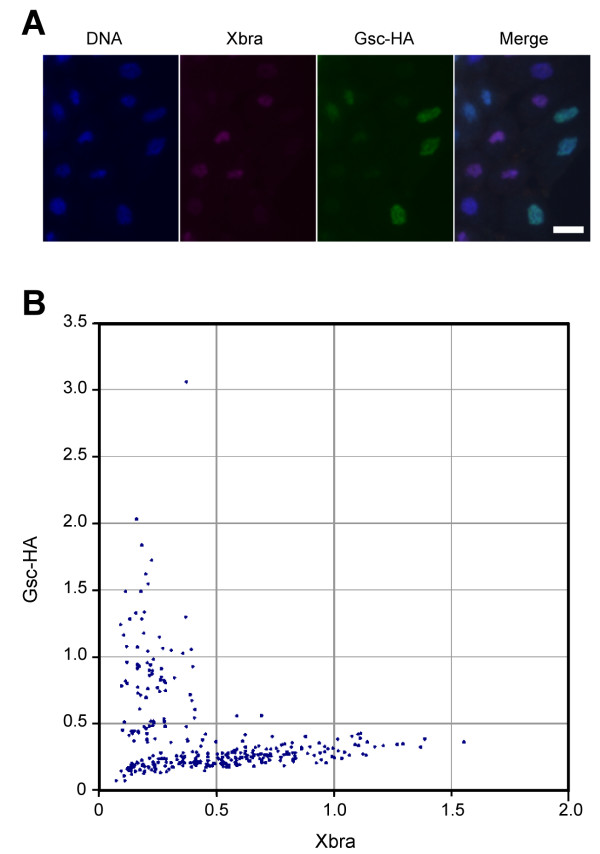
Results: Here we show that the concentration-dependent induction of the T-box transcription factor Brachyury (Xbra) and the homeobox-containing gene Goosecoid (Gsc) by activin in Xenopus can be explained by the dynamics of a simple network consisting of three elements with a mutual negative feedback motif that can function to convert a graded signal (activin) into a binary output (Xbra on and Gsc off, or vice versa). Importantly, such a system can display sharp thresholds. Consistent with the predictions of our model, Xenopus ectodermal cells display a binary response at the single cell level after treatment with activin.

Conclusion: This kind of simple network with mutual negative feedback might provide a general mechanism for selective gene activation in response to different levels of a single external signal. It provides a mechanism by which a sharp boundary might be created between domains of different cell types in response to a morphogen gradient.


Figures

Figure 1
Figure 1
Bifurcation and thresholds in a simple network with a mutual negative feedback motif. (A) Activin, Xbra and Gsc form a network in which Xbra and Gsc are both induced by activin and can inhibit each other's expression. This network can be abstracted into a general network consisting of M, A and B as illustrated. (B) Trajectory of the phase point in the phase plane (A, B). The behaviours of the network fall into three categories (see Additional file 1). These panels show a typical example of bifurcation with a threshold. The phase plane is divided into two basins (blue and green) by a border (separatrix) and each basin has one stable point (node). The phase point moves as indicated by the arrows. Movement of the phase point is analogous to a ball rolling in a landscape (the phase plane), which features a summit (saddle point: red diamond) and a ridge (separatrix). These features cause the ball to roll down into one low point or the other (nodes: purple diamonds) in each basin. The position of the separatrix depends on the value of M, with the initial phase point (0, 0) in the blue basin when M is below the threshold (left panel) or in the green basin when M is above the threshold (right panel). Insets show magnified views of the initial point. Black dots indicate the position of the phase point with interval of t = 0.5. Purple diamond, nodes; Red diamond, saddle point. (C) Steady state values of (A, B) are plotted against M. The threshold is between M = 1 and M = 2. The parameter values used for the simulation are ka = 5.5, kb = 5.4, α = 6, β = 3, kda = kdb = 1.
Figure 2
Figure 2
A plot of the area in the parameter plane (ka, kb) that allows the system to bifurcate. Bistability requires the balanced rates of synthesis of A and B (ka and kb). The product of cooperativity of the mutual repression between A and B must be greater than 1 (i.e. αβ > 1) for the system to bifurcate. μ = 3, kda = kdb = 1.
Figure 3
Figure 3
Relationship between parameters and threshold values of M. Threshold values are calculated and plotted and colour-coded as indicated. White areas indicate either that a threshold does not exist or that its value is above 5. (A) Threshold values are plotted in parameter plane (ka, kb). α = 6, β = 3, kda = kdb = 1. (B) Setting different values for the decay constants kda and kdb significantly broadens the range of possible parameter values of ka and kb that allows a threshold generation. Degradation constants are set to kda = 1 and kdb = 5. Note that the area in the parameter plane (ka, kb) that allows threshold (coloured area) is shifted and becomes much broader compared to (A). α = 6, β = 3. (C) Threshold values are plotted in parameter plane (α, β). ka = 5.5, kb = 5.4. (D) Steady state values of A and B plotted against M at the black dots in (C). Left panel, (α, β) = (2, 4). Right panel, (α, β) = (5, 2). ka = 5.5, kb = 5.4, kda = kdb = 1. Note that the two areas in (C) where the system is bistable with a threshold shows opposite steady state profiles. When α < β (area 1 in the middle panel in C), A is on and B is off with low M, and vice versa with high M at steady state. When α > β (area 2 in the middle panel in C), B is on and A is off with low M, and vice versa with high M at steady state.
Figure 4
Figure 4
Typical example of threshold creation when cooperativities of repression α and β are equal. Steady state values of A and B are plotted against M when α = β = 3, (ka, kb) = (6, 14) and (kda, kdb) = (1, 5), μ = 2.
Figure 5
Figure 5
A mutually repressive network with an additional element. (A) The homeobox-containing transcription factor Xom mediates the repression of Gsc by Xbra. The gene network can be abstracted into a general network consisting of M, A, B and C as illustrated. (B) Ordinary differential equations describing the dynamics of the network in (A). ka, kb and kc are respectively the rates of synthesis of A, B and C. α and γ are the cooperativities of repression by A and C, ε and μ are the cooperativities of induction by B and M, respectively. kda, kdb and kdc are the decay rate constants. The dynamics of A and B are similar to those in Additional file 1 and show bistability. (C) Simulations were performed with ka = kb = 5 and α = γ = 3 (μ = 1, kda = kdb = kdc = 1). Threshold values of M, which are colour-coded, are plotted in the parameter plane (kc, ε). kc and ε determine how the value of C changes over time. There are two areas in the parameter plane where the system is bistable with a threshold. With smaller values of kc and ε (area 1), B is on and A is off with low M, and vice versa with high M at steady state. With larger values of kc and ε (area 2), A is on and B is off with low M, and vice versa with high M at steady state. (D) Typical examples (black dots in (C)) of steady state values of A and B plotted against M. Left panel, (kc, ε) = (4, 2.5). Right panel, (kc, ε) = (12, 9). If smaller values of kc and ε are favoured in nature, the above observation may explain why at steady state and with low activin Xbra (which corresponds to B) is on and Gsc (which corresponds to A) is off, and vice versa with high activin.
Figure 6
Figure 6
Heterogeneous expression of Xbra in Xenopus animal pole blastomeres. (A) Heterogeneous expression of Xbra in Xenopus animal pole blastomeres treated with uniform concentrations of activin. Dissociated Xenopus animal cap cells were treated with various concentrations of activin as indicated. The cells were fixed and stained by indirect immunofluorescence using an anti-Xbra antibody. Yellow arrowheads indicate the nuclei that are Xbra-negative among positive nuclei (0.5 U) or vice versa (1 U). Cells were counterstained with Hoechst33342 (DNA). Scale bar = 50 μm. (B) Plot of Xbra versus DNA fluorescences. The fluorescence was quantified as described in Methods.
Figure 7
Figure 7
Mutually exclusive expressions of Xbra and Gsc in Xenopus animal pole blastomeres. (C) Mutually exclusive expressions of Xbra and Gsc in Xenopus animal pole blastomeres. Fertilised Xenopus embryos were injected with RNA encoding HA-tagged Gsc (Gsc-HA). Animal pole regions derived from these injected embryos and from uninjected embryos were mixed, dissociated and treated with 0.5 U/ml of activin. They were fixed after 7 hours of culture and stained with Hoechst 33342 (DNA) and processed for anti-Xbra and anti-HA staining. Scale bar = 20 μm. (D) Arbitrary fluorescence levels of anti-Xbra and anti-HA (Gsc) staining shown in (C) were calculated as described in Methods.

Similar articles

Cited by

References

    1. Ashe HL, Briscoe J. The interpretation of morphogen gradients. Development. 2006;133:385–394. doi: 10.1242/dev.02238. - DOI - PubMed
    1. Gurdon JB, Bourillot PY. Morphogen gradient interpretation. Nature. 2001;413:797–803. doi: 10.1038/35101500. - DOI - PubMed
    1. Wolpert L. Positional information and the spatial pattern of cellular differentiation. J Theor Biol. 1969;25:1–47. doi: 10.1016/S0022-5193(69)80016-0. - DOI - PubMed
    1. Scholpp S, Brand M. Endocytosis controls spreading and effective signaling range of Fgf8 protein. Curr Biol. 2004;14:1834–1841. doi: 10.1016/j.cub.2004.09.084. - DOI - PubMed
    1. Kinoshita T, Jullien J, Gurdon JB. Two-dimensional morphogen gradient in Xenopus: boundary formation and real-time transduction response. Dev Dyn. 2006;235:3189–3198. doi: 10.1002/dvdy.20963. - DOI - PubMed

Publication types