

Latent profile analysis in frontotemporal lobar degeneration and related disorders: clinical presentation and SPECT functional correlates
- PMID: 17506892
- PMCID: PMC1884173
- DOI: 10.1186/1471-2377-7-9
Latent profile analysis in frontotemporal lobar degeneration and related disorders: clinical presentation and SPECT functional correlates
Abstract
Background: Frontotemporal Lobar Degeneration (FTLD) thus recently renamed, refers to a spectrum of heterogeneous conditions. This same heterogeneity of presentation represents the major methodological limit for the correct evaluation of clinical designation and brain functional correlates. At present, no study has investigated clinical clusters due to specific cognitive and behavioural disturbances beyond current clinical criteria. The aim of this study was to identify clinical FTLD presentation, based on cognitive and behavioural profile, and to define their SPECT functional correlations.
Methods: Ninety-seven FTLD patients entered the study. A clinical evaluation and standardised assessment were preformed, as well as a brain SPECT perfusion imaging study. Latent Profile Analysis on clinical, neuropsychological, and behavioural data was performed. Voxel-basis analysis of SPECT data was computed.
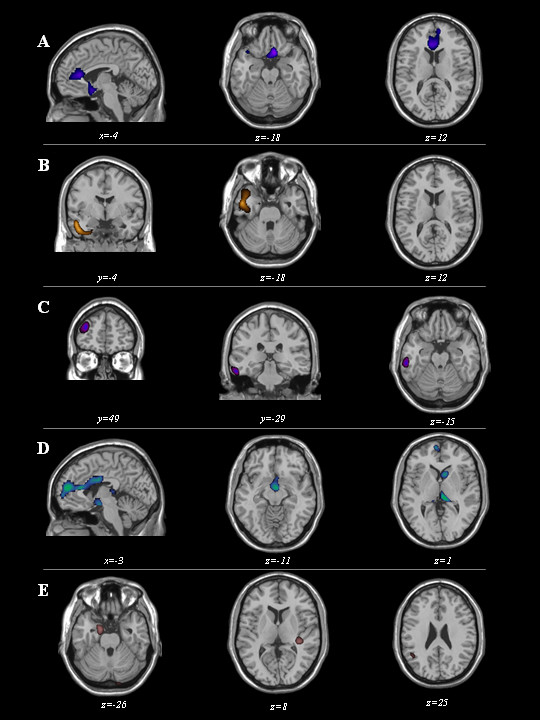
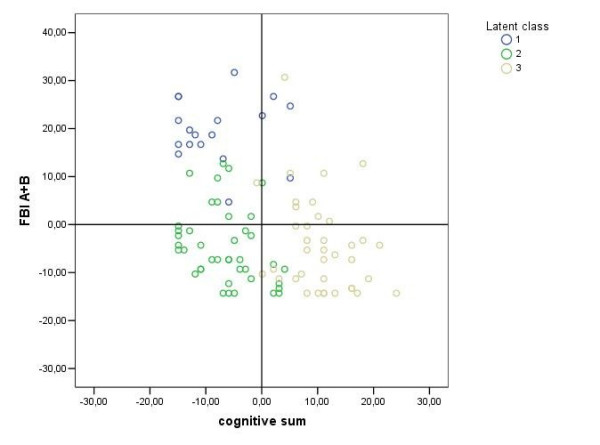
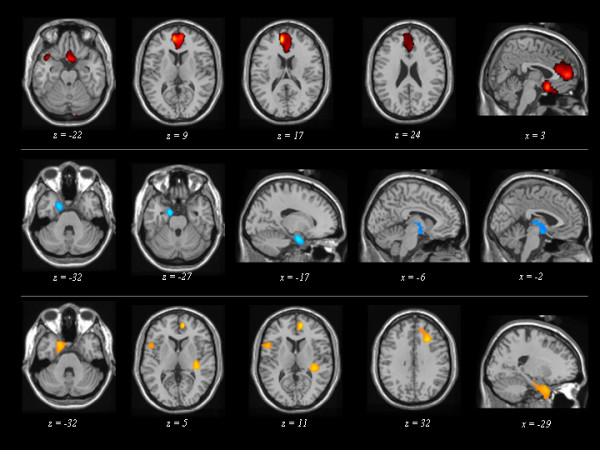
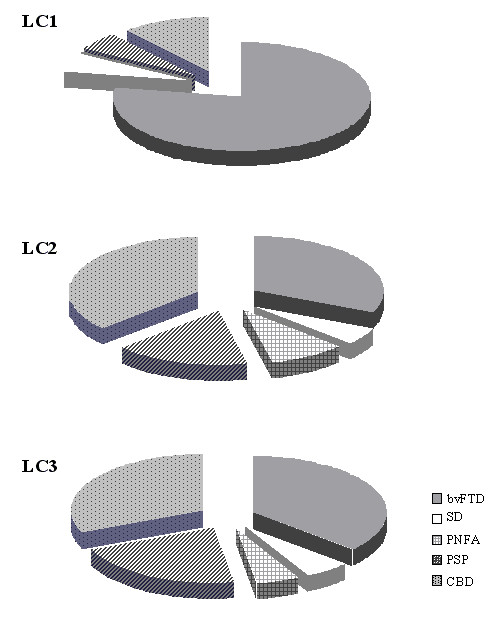
Results: Three specific clusters were identified and named "pseudomanic behaviour" (LC1), "cognitive" (LC2), and "pseudodepressed behaviour" (LC3) endophenotypes. These endophenotypes showed a comparable hypoperfusion in left temporal lobe, but a specific pattern involving: medial and orbitobasal frontal cortex in LC1, subcortical brain region in LC2, and right dorsolateral frontal cortex and insula in LC3.
Conclusion: These findings provide evidence that specific functional-cluster symptom relationship can be delineated in FTLD patients by a standardised assessment. The understanding of the different functional correlates of clinical presentations will hopefully lead to the possibility of individuating diagnostic and treatment algorithms.
Figures
Similar articles
-
Survival in frontotemporal lobar degeneration and related disorders: latent class predictors and brain functional correlates.Rejuvenation Res. 2009 Feb;12(1):33-44. doi: 10.1089/rej.2008.0812. Rejuvenation Res. 2009. PMID: 19236162 Clinical Trial.
-
The FTLD-modified Clinical Dementia Rating scale is a reliable tool for defining disease severity in frontotemporal lobar degeneration: evidence from a brain SPECT study.Eur J Neurol. 2010 May;17(5):703-7. doi: 10.1111/j.1468-1331.2009.02911.x. Epub 2009 Dec 29. Eur J Neurol. 2010. PMID: 20050899
-
[Frontal dementia or dementia praecox? A case report of a psychotic disorder with a severe decline].Encephale. 2003 Mar-Apr;29(2):172-80. Encephale. 2003. PMID: 14567169 French.
-
[Brain functional imaging of frontotemporal lobar degeneration].Brain Nerve. 2009 Nov;61(11):1275-84. Brain Nerve. 2009. PMID: 19938684 Review. Japanese.
-
[Frontotemporal dementia: a review].Encephale. 2007 Dec;33(6):933-40. doi: 10.1016/j.encep.2006.12.001. Epub 2007 Sep 6. Encephale. 2007. PMID: 18789785 Review. French.
Cited by
-
Loss of function mutations in the progranulin gene are related to pro-inflammatory cytokine dysregulation in frontotemporal lobar degeneration patients.J Neuroinflammation. 2011 Jun 6;8:65. doi: 10.1186/1742-2094-8-65. J Neuroinflammation. 2011. PMID: 21645364 Free PMC article.
-
Prognostic importance of apathy in syndromes associated with frontotemporal lobar degeneration.Neurology. 2019 Apr 2;92(14):e1547-e1557. doi: 10.1212/WNL.0000000000007249. Epub 2019 Mar 6. Neurology. 2019. PMID: 30842292 Free PMC article.
-
Enhancing theory of mind in behavioural variant frontotemporal dementia with transcranial direct current stimulation.Cogn Affect Behav Neurosci. 2018 Dec;18(6):1065-1075. doi: 10.3758/s13415-018-0622-4. Cogn Affect Behav Neurosci. 2018. PMID: 29995274 Clinical Trial.
-
Progranulin genetic variations in frontotemporal lobar degeneration: evidence for low mutation frequency in an Italian clinical series.Neurogenetics. 2008 Jul;9(3):197-205. doi: 10.1007/s10048-008-0127-3. Epub 2008 Apr 8. Neurogenetics. 2008. PMID: 18392865
References
-
- Kertesz A, Hudson L, Mackenzie IR, Munoz DG. The pathology and nosology of primary progressive aphasia. Neurology. 1994;44:2065–72. - PubMed
