

doi: 10.1128/JVI.00555-07.
Epub 2007 May 16.
Evidence for cooperative transforming activity of the human pituitary tumor transforming gene and human T-cell leukemia virus type 1 Tax
Affiliations
- PMID: 17507465
- PMCID: PMC1951308
- DOI: 10.1128/JVI.00555-07
Item in Clipboard
Evidence for cooperative transforming activity of the human pituitary tumor transforming gene and human T-cell leukemia virus type 1 Tax
J Virol.
2007 Aug.
Abstract
Aneuploidy is frequent in cancers. Recently it was found that pituitary tumor transforming gene (PTTG; also called Pds1p or securin) is overexpressed in many different tumors. Human T-cell leukemia virus type 1 (HTLV-1) is a retrovirus that primarily infects CD4+ T lymphocytes and causes adult T-cell leukemia. Here, we report that overexpression of human PTTG cooperated with the HTLV-I Tax oncoprotein in cellular transformation. Coexpression of Tax and PTTG enhanced chromosomal instability and neoplastic changes to levels greater than overexpression of either factor singularly. Cells that overexpressed both PTTG and Tax induced tumors more robustly in nude mice than cells that expressed either PTTG alone or Tax alone.
Figures
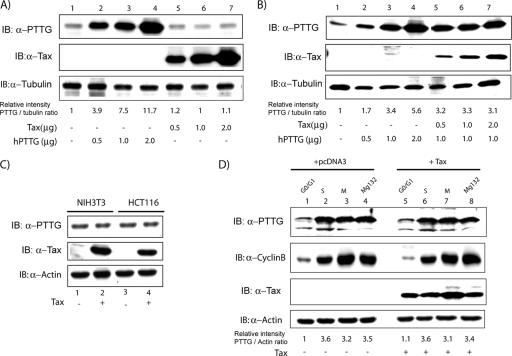
Tax does not increase PTTG degradation. (A) HeLa cells were transfected with a PTTG expression vector (lanes 2 to 4) or a Tax plasmid (lanes 5 to 7). Whole-cell lysates were prepared, resolved by 12% sodium dodecyl sulfate-polyacrylamide gel electrophoresis (SDS-PAGE), and probed with anti-PTTG, anti-Tax, or anti-tubulin. The PTTG expression level was quantified by densitometry and normalized against tubulin. (B) HCT116 cells were transfected as indicated with a PTTG expression vector (lanes 2 to 7) or a Tax plasmid (lanes 5 to 7). Whole-cell lysates were prepared, resolved by 12% SDS-PAGE, and probed with anti-PTTG, anti-Tax, or anti-tubulin. The PTTG expression level was quantified by densitometry and normalized against tubulin. (C) NIH 3T3 and HCT116 cells were transfected with either a control pCDNA 3.0 vector (lanes 1 and 3) or 2 μg of Tax-expressing vector (lanes 2 and 4). At 48 h later, whole-cell lysates were prepared and resolved by 12% SDS-PAGE. Amounts of PTTG and Tax in cell extracts were assayed using anti-PTTG or anti-Tax. Equal protein loading was verified with anti-actin (lower panel). (D) Expression of cellular endogenous PTTG in synchronized HCT116 cells was monitored in the absence or presence of HTLV-1 Tax. HCT116 cells were transfected with either a control pCDNA 3.0 vector (lanes 1 to 4) or a Tax plasmid (lanes 5 to 8). Three hours after transfection, cells were separately synchronized for 24 h in low FCS (0.5%; for G0/G1 phase), hydroxyurea (2 mM; for S phase), or nocodazole (0.2 μg/ml; for G2/M phase). In parallel, cells were also treated with the proteasome inhibitor MG132 for 8 h. Whole-cell lysates were prepared, resolved by 12% SDS-PAGE, and probed with anti-PTTG, anti-Tax, anti-cyclin B1, or anti-tubulin. Equal loading of protein in the cell extract was verified with antiactin antibody (lower panel). The PTTG expression level was quantified by densitometry and normalized against actin.
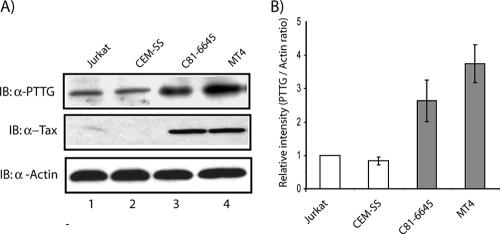
Stability of cellular endogenous PTTG is not affected by Tax in ATL cells. Whole-cell lysates from the non-ATL cell lines Jurkat and CEM-SS (lanes 1 and 2) and HTLV-1-transformed C81-6645 and MT4 cells (lanes 3 and 4) were prepared, resolved by 12% sodium dodecyl sulfate-polyacrylamide gel electrophoresis, and probed with anti-PTTG, anti-Tax, or antiactin (for a loading control). PTTG protein expression was measured by densitometry. A representative experiment is shown in panel A, and the means and standard deviations of three experiments are shown in panel B.
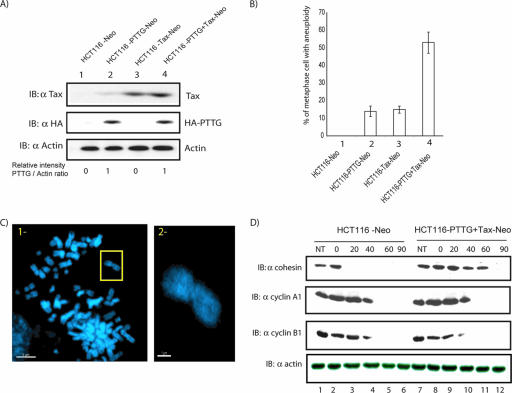
HCT116 cells expressing PTTG plus Tax have increased chromosomal instability. (A) HCT116 cells stably expressing a neo vector, HTLV-1 Tax-neo, HA-PTTG-neo, or Tax plus HA-PTTG-neo were selected using G418. Whole-cell lysates from HCT116-neo (lane 1), HCT116-Tax (lane 2), HCT116-PTTG (lane 3), and HCT116-PTTG plus Tax (lane 4) were prepared, resolved by 12% sodium dodecyl sulfate-polyacrylamide gel electrophoresis (SDS-PAGE), and probed with anti-Tax, anti-HA, or antiactin. The PTTG expression level was quantified by densitometry and normalized against actin. (B) Quantification of the frequency of aneuploidy observed from metaphase spreads of HCT116 cells stably expressing a control neo vector, Tax alone, PTTG alone, or Tax plus PTTG. (C) An example of chromosome spreads of HCT116 stably expressing Tax plus PTTG. Before harvesting, cells were treated with nocodazole for 18 h to enrich for mitotic cells, which were collected by mitotic shake-off. Note the frequent finding of tethered sister chromatids (left), with one example shown in an enlarged view (right). (D) Immunoblot analysis of the kinetics of cohesin degradation. Before harvesting, cells were treated with nocodazole to enrich for mitotic cells. Shown are the times in minutes after removal of nocodazole (top). Whole-cell lysates from HCT116-neo (lanes 1 to 6) and HCT116-PTTG plus Tax (lanes 7 to 12) were prepared, resolved by 10% SDS-PAGE, and probed with anticohesin, anti-cyclin A1, anti-cyclin B1, or antiactin (for loading control). Note the delayed cohesin degradation in PTTG plus Tax compared to Neo cells in the top panel, while the degradation kinetics of control cyclin A1 and B1 were unchanged.
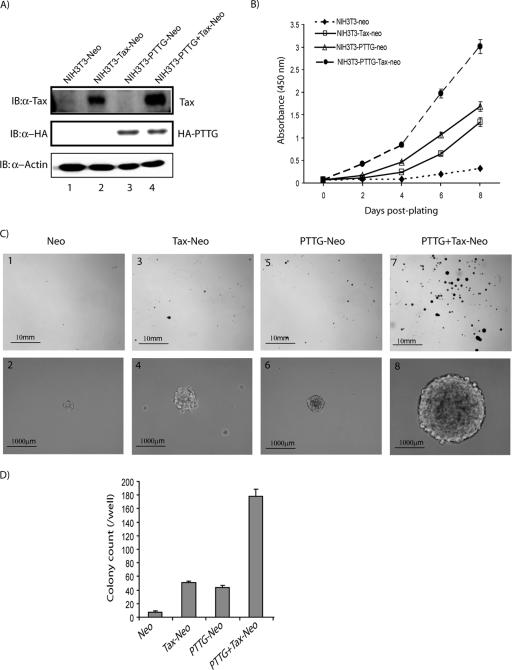
Coexpression of PTTG plus Tax enhances cellular transformation. (A) Stable expression of neo, PTTG, Tax, and PTTG plus Tax in G418-selected NIH 3T3 clones. Whole-cell lysates from NIH 3T3 neo (lane 1), NIH 3T3 Tax-neo (lane 2), NIH 3T3 PTTG-neo (lane 3), and NIH 3T3 PTTG plus Tax-neo (lane 4) were prepared, resolved by 12% sodium dodecyl sulfate-polyacrylamide gel electrophoresis, and probed with anti-Tax, anti-HA (for PTTG detection), or antiactin (for loading control). (B) Tax, PTTG, and PTTG plus Tax expression enhance cell proliferation. NIH 3T3 cells expressing NIH 3T3 neo, NIH 3T3 Tax-neo, NIH 3T3 PTTG-neo, and NIH 3T3 PTTG plus Tax-neo were cultured in DMEM plus low serum (0.1% FCS). Cells were monitored for proliferation using WST-8 [2-(2-methoxy-4-nitrophenyl)-3-(4-nitrophenyl)-5-(2,4-disulfophenyl)-2H-tetrazolium, monosodium salt] coloration (Dojindo) according to the manufacturer's protocol. Relative absorbances at 450 nm shown in arbitrary values are means ± standard deviations of three independent experiments. (C) NIH 3T3 cells were stably transfected with control vector (panels 1 and 2), Tax (panels 3 and 4), PTTG (panels 5 and 6), or Tax plus PTTG (panels 7 and 8). Cells were plated at a concentration of 1,000 cells/ml and tested for their ability to form colonies in soft agar (see Materials and Methods). (D) Colonies, as indicated, were counted after 14 days. The mean values from three different experiments are shown.
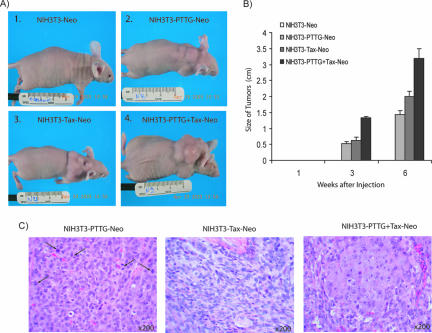
In vivo tumorigenicity of PTTG plus Tax NIH 3T3 cells in nude mice. (A) Six-week-old female athymic nude mice (Harlan, Indianapolis, IN) were injected subcutaneously in the neck region with 5 × 10⁶ G418 NIH 3T3 neo (panel 1), NIH 3T3 PTTG-neo (panel 2), NIH 3T3 Tax-neo (panel 3), or NIH 3T3 PTTG plus Tax-neo (panel 4) cells. (B) Following injection, mice were monitored with calipers, and mice were sacrificed as described in the text. (C) The tumors were resected and stained with hematoxylin and eosin for histopathological examination. Tax or PTTG alone induced poorly differentiated fibrosarcomas (panels 1 and 2) with mitotic figures (arrows); tumors induced by coexpression of Tax plus PTTG displayed fibrosarcomas and carcinomas with foci of necrosis (panel 3).
References
-
- Akagi, T., H. Ono, N. Tsuchida, and K. Shimotohno. 1997. Aberrant expression and function of p53 in T-cells immortalized by HTLV-I Tax1. FEBS Lett. 406:263-266. - PubMed
-
- Anderson, M. D., J. Ye, L. Xie, and P. L. Green. 2004. Transformation studies with a human T-cell leukemia virus type 1 molecular clone. J. Virol. Methods 116:195-202. - PubMed
-
- Ariumi, Y., A. Kaida, J. Y. Lin, M. Hirota, O. Masui, S. Yamaoka, Y. Taya, and K. Shimotohno. 2000. HTLV-1 tax oncoprotein represses the p53-mediated trans-activation function through coactivator CBP sequestration. Oncogene 19:1491-1499. - PubMed
-
- Bernal, J. A., R. Luna, A. Espina, I. Lazaro, F. Ramos-Morales, F. Romero, C. Arias, A. Silva, M. Tortolero, and J. A. Pintor-Toro. 2002. Human securin interacts with p53 and modulates p53-mediated transcriptional activity and apoptosis. Nat. Genet. 32:306-311. - PubMed
Publication types
MeSH terms
Substances
LinkOut - more resources
Full Text Sources
Research Materials
