Comparative Study
. 2007 May 16;27(20):5271-9.
doi: 10.1523/JNEUROSCI.0883-07.2007.

Genetic single-cell mosaic analysis implicates ephrinB2 reverse signaling in projections from the posterior tectum to the hindbrain in zebrafish

Affiliations
Comparative Study

Genetic single-cell mosaic analysis implicates ephrinB2 reverse signaling in projections from the posterior tectum to the hindbrain in zebrafish

Tomomi Sato et al. J Neurosci. .

Abstract

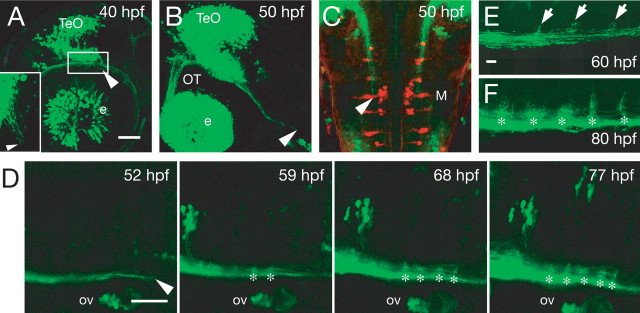
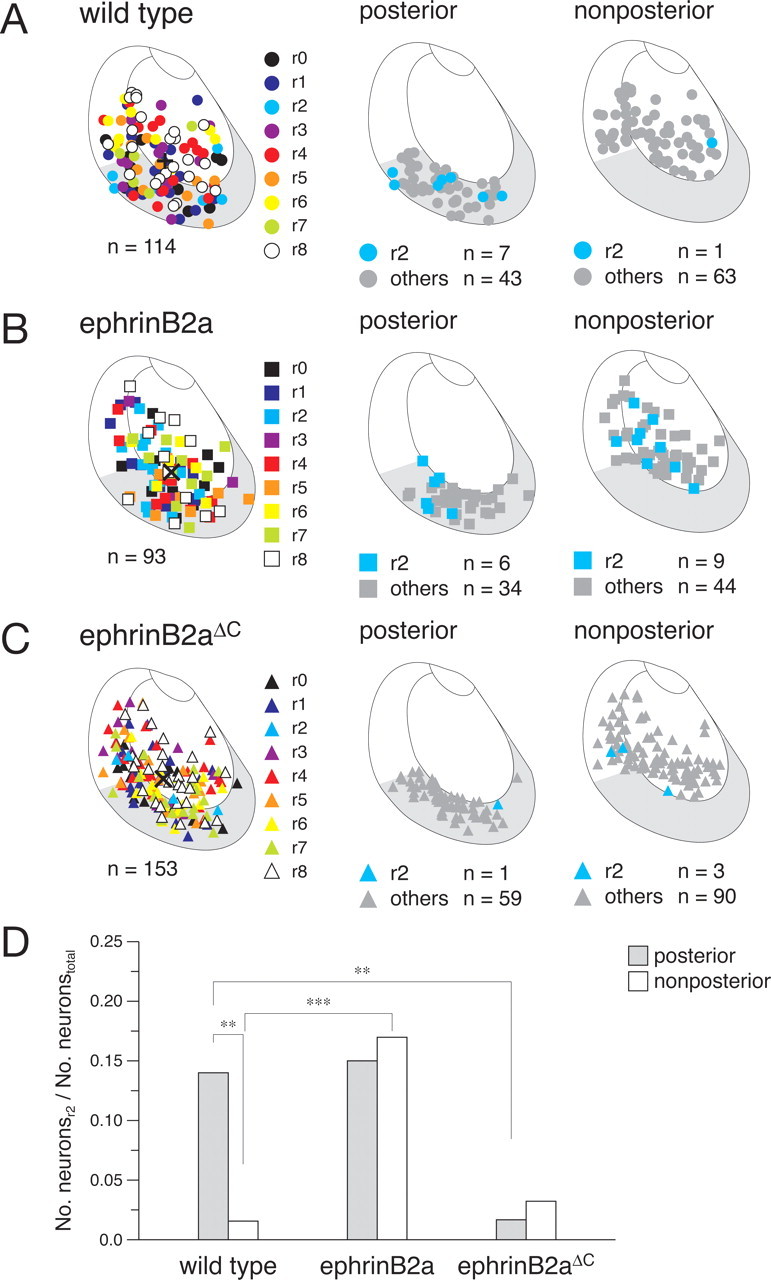
The optic tectum is a visual center in vertebrates. It receives topographically ordered visual inputs from the retina in the superficial layers and then sends motor outputs from the deeper layers to the premotor reticulospinal system in the hindbrain. Although the topographic patterns of the retinotectal projection are well known, it is not yet well understood how tectal efferents in the tectobulbar tract project to the hindbrain. The retinotectal and the tectobulbar projections were visualized in a zebrafish stable transgenic line Tg(brn3a-hsp70:GFP). Using a single-neuron labeling system in combination with the cre/loxP and Gal4/UAS systems, we showed that the tectal neurons that projected to rhombomeres 2 and 6 were distributed with distinctive patterns along the anterior-posterior axis. Furthermore, we found that ephrinB2a was critically involved in increasing the probability of neurons projecting to rhombomere 2 through a reverse signaling mechanism. These results may provide a neuroanatomical and molecular basis for the motor command map in the tectum.


Figures

Figure 1.
Figure 1.
GFP expression in Tg(brn3a-hsp70:GFP) embryos. A, Structure of the zebrafish brn3a gene and the brn3a-hsp70:GFP transgene. A regulatory region of the brn3a gene contains a 4.9 kb upstream region (thick bar), a noncoding region (blue box), a part of the coding region (black box), and an intron (gray box). hsp70 promoter (yellow box) and EGFP (green box) sequences were inserted downstream of the regulatory region. The transcription start site is indicated as +1. S, SacI. B, C, Bright-field (B) and GFP fluorescence (C) images of a transgenic embryo at 3 dpf. D, Anterolateral view of the brain at 5 dpf. E, A transverse section of the brain at 7 dpf. Dorsal is upward. ITC, Intertectal commissure; Ha, habenula; OT, optic tract; Pt, pretectum; TS, torus semicircularis; VTF, ventral tectal fascicles; TeO, optic tectum; e, eye. Scale bar, 50 μm.
Figure 2.
Figure 2.
Ipsilaterally descending tectobulbar tracts expressing GFP in Tg(brn3a-hsp70:GFP). A, C, D, Reticulospinal neurons were retrogradely labeled with rhodamine-conjugated dextran (red). A, Ventral view; anterior is upward. The arrowhead indicates the tip of the tectobulbar tract. B, Ventral view; anterior is upward. DiI (red) was injected into the right tectal hemisphere at 7 dpf. The ipsilaterally descending (filled arrowhead) and the contralaterally descending (open arrowhead) tectobulbar tracts were labeled with GFP and DiI, respectively. C, Lateral view; anterior is left, and dorsal is upward. Asterisks indicate each branching point from the tectobulbar tract. D, A transverse section of the brain from the location shown by the rectangle in A. E, F, Transverse sections of the adult brain. Red fluorescence indicates nuclei stained with SYTOX orange. M, Mauthner neuron; MiD, middle dorsal; MiV, middle ventral; mlf, medial longitudinal fascicle; n ve, vestibular nucleus; PGZ, periventricular gray zone; SAC, stratum album centrale; SFGS, stratum fibrosum et griseum superficiale; SGC, stratum griseum centrale; SO, stratum opticum; SPV, stratum periventriculare; TeO, optic tectum; TSc and TSvl, central and ventrolateral nucleus of torus semicircularis, respectively; TTB, tectobulbar tract. Scale bars: A, C, 50 μm; D, F, 20 μm; E, 100 μm.
Figure 3.
Figure 3.
Development of the tectobulbar tract in Tg(brn3a-hsp70:GFP) embryos. A–C, Embryos fixed at 40 hpf (A) and 50 hpf (B, C) shown in lateral view (A, B) and dorsal view (C). The arrowhead indicates the tip of the tectobulbar tract. A, Inset, A region surrounded by a white rectangle in dorsal view. D, Time-lapse imaging of the tectobulbar tract from 52 hpf. Anterior is left, and dorsal is upward. Asterisks indicate the branching points. E, F, Brain fixed at 60 hpf (E) and 80 hpf (F) shown in lateral view. Arrows indicate initial dorsal branches. Asterisks indicate branching points. e, Eye; M, Mauthner neuron; OT, optic tract; ov, otic vesicle; TeO, optic tectum. Scale bars: A, D, 50 μm; E, 10 μm.
Figure 4.
Figure 4.
Genetic single-neuron labeling system and labeled neurons. A, Single-neuron labeling system in combination with Cre/loxP and Gal4/VP16 systems. B–K, Filled arrowheads indicate the soma of a labeled neuron. Open arrowheads indicate the final projection site of the labeled axon. B, J, K, An example of a brain with labeled neurons in the tectum at 7 dpf, shown in lateral view (B), dorsal view (J), and ventral view (K). C, Tectal neurons with dendrites labeled in different colors (brackets), at 7 dpf, shown in dorsal view. D–I, Several types of neuron labeled in this study shown in dorsal view (D, F, H) and lateral view (E, G, I): a neuron with wide-field radial dendrites and an ipsilaterally descending axon (D, E), a neuron with small-field horizontal dendrites and an ipsilaterally descending axon (F, G), an interneuron without a descending projection (F, small arrow), a neuron with an axon through the tectal commissure (H, arrowhead), and a neuron in the torus semicircularis (I). J, Open circle indicates the location of the soma. K, An overlaid image of labeled reticulospinal neurons indicates projection to r2 in the hindbrain. Scale bars: B, C, D, J, 50 μm.
Figure 5.
Figure 5.
Dendritic arborization fields of labeled neurons. Ratios of dendritic arborization fields (as shown by the polygon in Fig. 4 J) to the areas of the tectal hemisphere (as outlined by the thin line in Fig. 4 J) are plotted for the labeled neurons at 7 dpf (n = 87). The means (±SE, SEM) are shown by the horizontal bars for the total tectal neurons (black) and the four different groups (very large, 14.56 ± 1.37%, red; large, 9.17 ± 0.16%, orange; middle, 6.88 ± 0.08%, green; small, 4.10 ± 1.18%, blue).
Figure 6.
Figure 6.
Distributions of labeled neurons in the tectum. A, Locations of somata for 114 labeled neurons in the tectum at 7 dpf, shown in the right hemisphere in dorsal view. Somata are indicated by circles that are color-coded according to the projection to each hindbrain segment. The pink polygon (bottom) indicates the arborization field of a single retinal axon (shown in B), with an overlay of the somata located within the same region. B, A brain with labeled neurons at 7 dpf shown in dorsal view. Thick and thin lines outline the midbrain and tectum, respectively. C, The locations of somata are shown for the projection to each hindbrain segment from r0 to r8. Crosses indicate centers of gravity. D, Comparison of the distributions of neurons projecting to r2 with those projecting to r6 in the centers of gravity (p < 0.05; Kruskal–Wallis with Bonferroni posttest). The shaded region indicates an arbitrarily defined posterior region of the tectum.
Figure 7.
Figure 7.
Effects of the ectopic expression of ephrinB2a and ephrinB2a ΔC on the probabilities of neurons projecting to r2. A, Locations of somata for 114 labeled neurons in wild-type embryos (colored circles, left). Wild-type neurons projecting to r2 (blue circles) and the other labeled neurons (gray circles) in the posterior tectum (middle) and the nonposterior tectum (right). B, Locations of somata for 93 labeled neurons expressing ephrinB2a (left, colored squares). ephrinB2a-expressing neurons projecting to r2 (blue squares) and the other labeled neurons (gray squares) in the posterior tectum (middle) and the nonposterior tectum (right). C, Locations of somata for 153 labeled neurons expressing ephrinB2a ΔC (left, colored triangles). ephrinB2a ΔC-expressing neurons projecting to r2 (blue triangles) and the other labeled neurons (gray triangles) in the posterior tectum (middle) and the nonposterior tectum (right). A–C, Crosses indicate the centers of gravity of the distributions of labeled neurons. D, Ratios of the number of neurons projecting to r2 to the total number of labeled neurons in the posterior tectum (shaded columns) and in the nonposterior tectum (open columns) for wild-type, ephrinB2a, and ephrinB2aΔC embryos. Pairwise comparisons of ratios with significant differences: **p < 0.01 and ***p < 0.001 (two-tailed binomial test).

Similar articles

Cited by

References

    1. Aizawa H, Bianco IH, Hamaoka T, Miyashita T, Uemura O, Concha ML, Russell C, Wilson SW, Okamoto H. Laterotopic representation of left-right information onto the dorso-ventral axis of a zebrafish midbrain target nucleus. Curr Biol. 2005;15:238–243. - PMC - PubMed
    1. Al-Akel AS, Guthrie DM, Banks JR. Motor responses to localized electrical stimulation of the tectum in the freshwater perch (Perca fluviatilis) Neuroscience. 1986;19:1381–1391. - PubMed
    1. Bovenkamp DE, Greer P. Novel Eph-family receptor tyrosine kinase is widely expressed in the developing zebrafish nervous system. Dev Dyn. 1997;209:166–181. - PubMed
    1. Chan J, Mably JD, Serluca FC, Chen JN, Goldstein NB, Thomas MC, Cleary JA, Brennan C, Fishman MC, Roberts TM. Morphogenesis of prechordal plate and notochord requires intact Eph/ephrin B signaling. Dev Biol. 2001;234:470–482. - PubMed
    1. Cooke J, Moens C, Roth L, Durbin L, Shiomi K, Brennan C, Kimmel C, Wilson S, Holder N. Eph signalling functions downstream of Val to regulate cell sorting and boundary formation in the caudal hindbrain. Development. 2001;128:571–580. - PubMed

Publication types

MeSH terms