Comparative Study
. 2007 May 16;27(20):5301-12.
doi: 10.1523/JNEUROSCI.0376-07.2007.

Heterosynaptic scaling of developing GABAergic synapses: dependence on glutamatergic input and developmental stage

Affiliations
Comparative Study

Heterosynaptic scaling of developing GABAergic synapses: dependence on glutamatergic input and developmental stage

Yan Liu et al. J Neurosci. .

Abstract

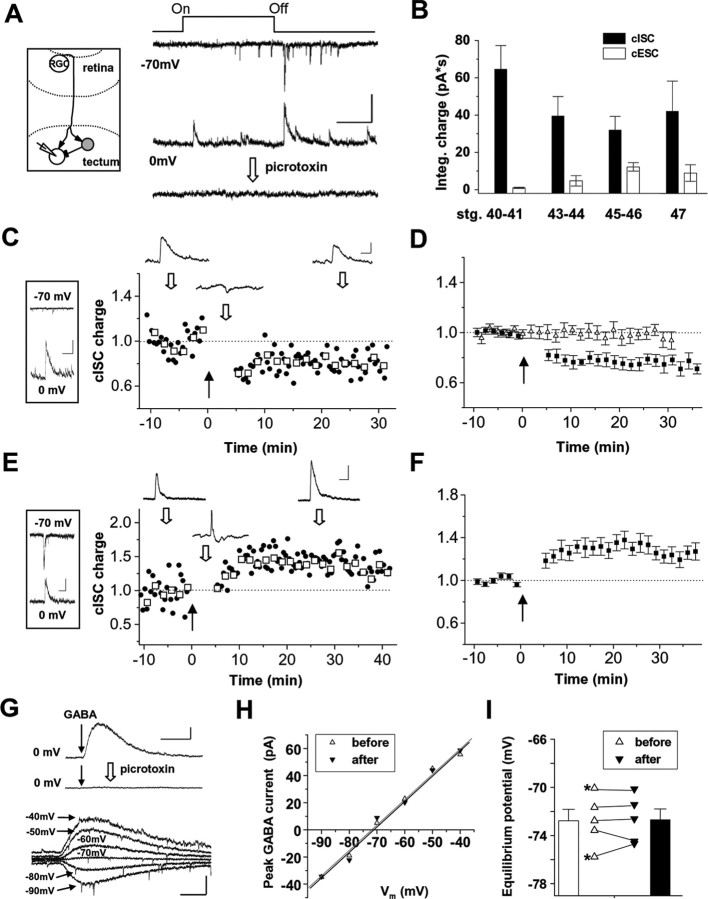
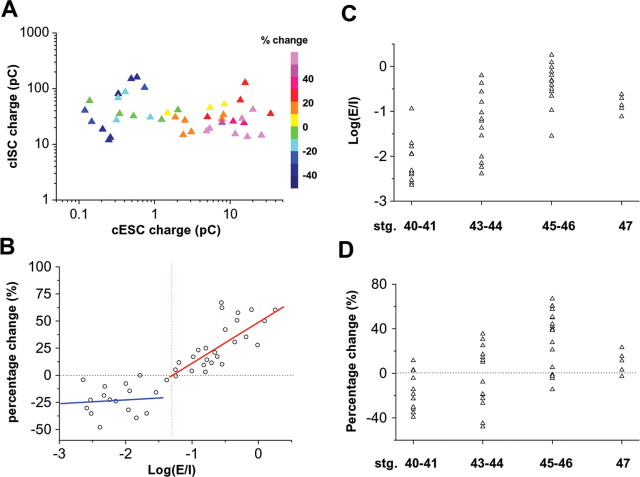
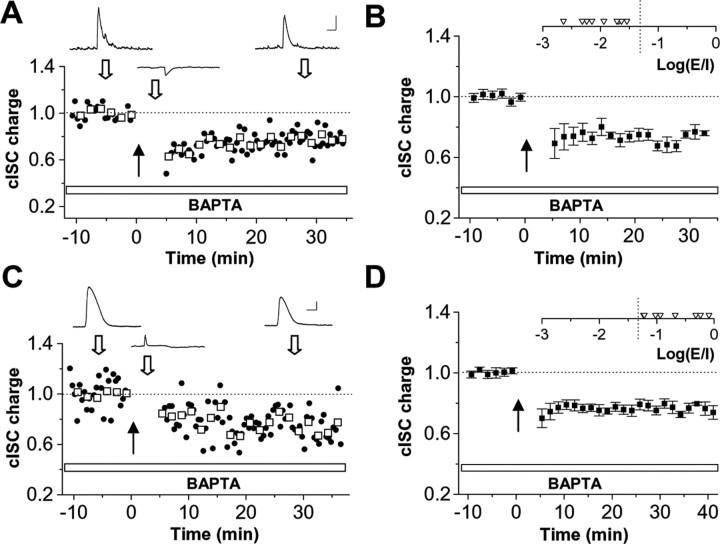
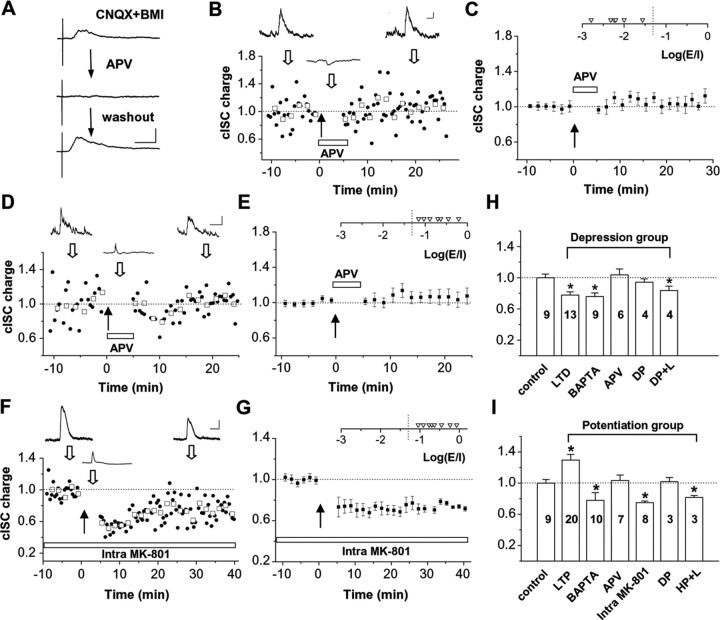
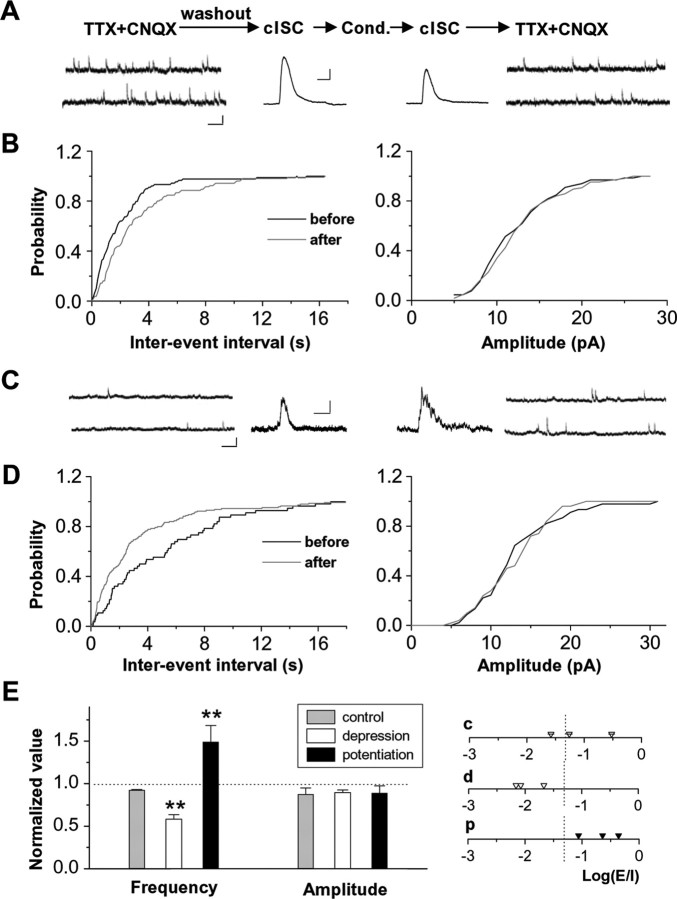
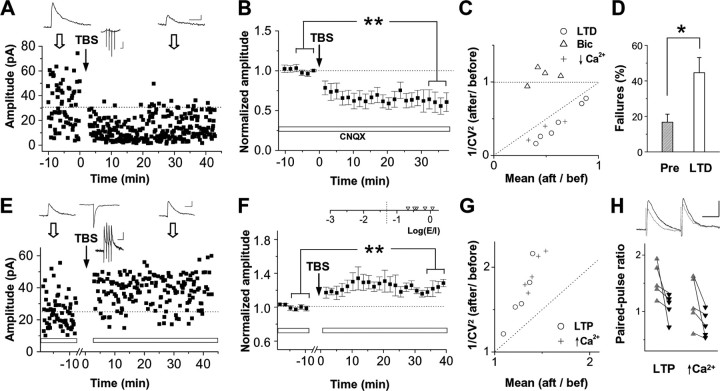
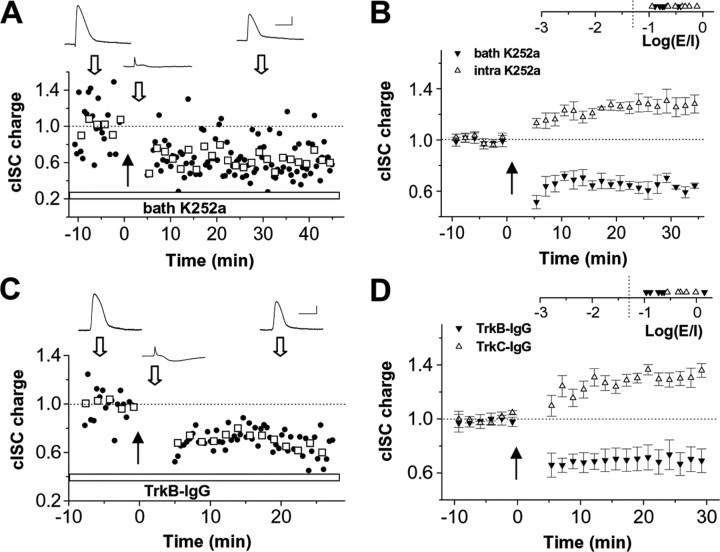
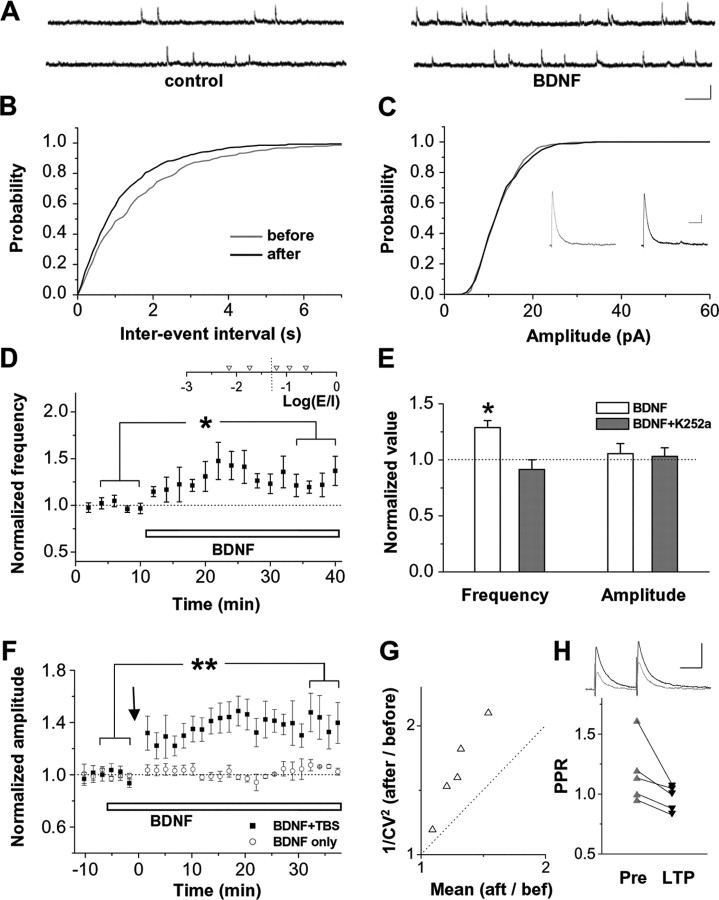
A proportionality or balance between coactivated excitatory and inhibitory inputs is often observed for individual cortical neurons and is proposed to be important for their functions. This feature of neural circuits may arise from coordinated modulation of excitatory and inhibitory synaptic inputs, a mechanism that remains unknown. Here, in vivo whole-cell recordings from tectal neurons of young Xenopus tadpoles reveals activity-dependent bidirectional modifications of GABAergic inputs. At early developmental stages when GABAergic inputs dominate visually evoked responses, repetitive visual stimulation leads to long-term depression of GABAergic inputs. At later stages when convergent glutamatergic inputs are much stronger, long-term potentiation (LTP) of GABAergic inputs is induced. The polarity of GABAergic plasticity depends on the ratio between the magnitude of coactivated glutamatergic and GABAergic inputs (E/I ratio) to the tectal cell: LTP is induced only when the E/I ratio is above a threshold, and the level of LTP correlates linearly with the logarithm of the E/I ratio. The induction of LTP requires the activation of postsynaptic NMDA receptors, as well as presynaptic TrkB signaling likely through retrograde BDNF (brain-derived neurotrophic factor) and is achieved by overcoming a predominant depression process mediated by NMDA receptors on the presynaptic GABAergic neurons. Our results indicate that the strength of developing GABAergic synapses can be scaled in accordance to coactivated convergent glutamatergic input. This mechanism may contribute to the formation of functional neural circuits with correlated excitatory and inhibitory inputs.


Figures

Figure 1.
Figure 1.
Visual conditioning-induced bidirectional plasticity of GABAergic input. A, Left, Schematic diagram of a feedforward inhibitory circuit in the tectum. Local GABAergic interneurons (gray circle) receive excitatory drive from RGC inputs and make connections with other tectal neurons. Right, Example synaptic responses in a stage 43 tectal cell, each evoked by a 1.5 s whole-field light stimulus (represented by dark lines on top; On, change of screen color from black to white; Off, return to black) and recorded at Vh of −70 and 0 mV, respectively. Bottom trace, Response recorded at 0 mV was blocked after bath application of 100 μm picrotoxin. Calibration: 50 pA, 500 ms. B, Average integrated charges of whole-field light-evoked cISC and cESC at different developmental stages (stg.) (n = 12, 14, 17, 6 for groups 1–4). There is a significant decrease in cISC and a significant increase in cESC from stage 40–41 to 45–46 (p < 0.05). C, Left, In this example cell of a stage 40–41 tadpole, visual stimulus elicited a large cISC when recorded at 0 mV (bottom) but no significant glutamatergic response when recorded at −70 mV (top). Calibration: 60 pA, 500 ms. Right, Normalized integrated charge of cISC before and after visual conditioning (marked by the black arrow) in the same cell. Each data point was normalized to the control value (averaged during the 10 min period before the conditioning). Circles represent each sampled cISC. Squares represent average value for four consecutive cISCs. Traces on top are average responses (from 8 trials) before, during, and after conditioning, at times indicated by the open arrows. Calibration: 50 pA/20 mV, 250 ms. D, Summary of 13 similar experiments (filled symbols). Data represent mean ± SEM. Open symbols are for summary of nine control experiments in which cISCs were monitored continuously at Vh of 0 mV and at 0.04 Hz. E, Left, Light-evoked cESC and cISC (single trial) in an example cell at stage 45–46, recorded at −70 and 0 mV, respectively. Calibration: 40 pA, 200 ms. Right, Normalized integrated charge of cISC for the same cell before and after conditioning. Calibration: 40 pA/12 mV, 250 ms. F, Summary of 12 similar experiments. G, Top, Currents evoked by puffing GABA (indicated by the arrow) were completely blocked by picrotoxin (100 μm). Calibration: 40 pA, 500 ms. Bottom, GABA-evoked currents recorded at six different membrane potentials in an example cell. Each trace was average from three trials. Calibration: 30 pA, 200 ms. H, Current–voltage relationship for GABA-evoked currents before and 10–15 min after visual conditioning for the same cell. Data point represents average value of five to eight trials. Lines are best fits using linear regression. Black line is for after conditioning. The reversal potential for Cl currents is taken as the x-intercept of the best-fit line. I, Measured Cl equilibrium potentials in five experiments. The asterisk indicates the cell that exhibited a dominating cISC. Bars are for mean ± SEM.
Figure 2.
Figure 2.
Dependence of cISC plasticity on the level of coactivated convergent cESC and developmental stage (stg.). A, The percentage change in average cISC charge (color coded, see the color scale on the right) at 20–25 min after visual conditioning, plotted as a function of the initial integrated charge of cESC and cISC. Each data point represents one individual experiment. B, The percentage change in cISC charge is plotted against the logarithm of the ratio between cESC and cISC charges or Log(E/I). The red and blue lines represent best fits using linear regression for data points that have a Log(E/I) value of lower and higher than −1.5, respectively. The vertical dash line indicates the x-intercept of the red line. C, Distribution of Log(E/I) values at different developmental stages. Each data point represents one cell. Significant difference was observed between each pair of neighboring age groups (p < 0.01). D, Distribution of percentage changes in cISC charge after conditioning in the same group of cells.
Figure 3.
Figure 3.
Differential dependence of cISC plasticity on postsynaptic Ca2+ increase. A, An example experiment in which 10 mm BAPTA was loaded into a tectal cell, which had a dominating cISC. Data are presented as in Figure 1. Calibration: 100 pA/20 mV, 250 ms. B, Summary of nine experiments. Inset shows the distribution of Log(E/I) values in these cells. The dotted vertical line represents the estimated threshold Log(E/I) value for the induction of potentiation. C, D, The effect of BAPTA loading in cells that belong to the potentiation group. Data are presented as in A and B. Calibration: 50 pA/20 mV, 200 ms.
Figure 4.
Figure 4.
Depression and potentiation of cISCs depend on NMDA receptors located at presynaptic and postsynaptic cells, respectively. A, Example NMDA receptor-mediated synaptic currents recorded at +55 mV, with CNQX (10 μm) and bicuculline (BMI; 10 μm) present in constantly perfused bath solution. Currents were evoked by the electrical stimulation of the optic fibers. Traces are average of 10 trials before (top) and after (middle) local iontophoresis of APV and 3 min after the beginning of the washout of APV (bottom). Calibration: 50 pA, 200 ms. B, An example experiment in a cell with a dominating cISC. APV was iontophoretically applied to the tectum during the course marked by the white bar. Calibration: 10 pA/10 mV, 250 ms. C, Summary of six experiments. The distribution of initial Log(E/I) values is shown in the inset. D, E, The effect of iontophoretic application of APV on the induction of potentiation of cISCs (n = 7). Calibration: 50 pA/20 mV, 200 ms. F, G, The effect of postsynaptic loading of MK-801 (1 mm) on the induction of potentiation (n = 8). Calibration: 20 pA/20 mV, 200 ms. H, I, Summary of depression and potentiation of cISCs under various conditions. Bars represent normalized changes of cISC charges after visual conditioning (mean ± SEM). LTD, Long-term depression; DP, 100 depolarizing current injections (200 ms) at 0.4 Hz; DP+L, repetitive light stimuli with each coupled with a 200 ms depolarizing current injection; LTP, long-term potentiation; HP+L, repetitive light stimuli with each coupled with a 200 ms hyperpolarizing current injection. The number of experiments in each group is labeled in each bar. *p < 0.01.
Figure 5.
Figure 5.
Depression and potentiation of cISCs are associated with changes in presynaptic release. A, Top, Experimental procedure for monitoring mIPSCs before and after visual conditioning (Cond.). The recording session is 8–10 min for mIPSCs and 5–10 min for cISCs. The washout session is 10 min. Bottom, Example traces for recording from a stage 42 cell (Vh of 0 mV) of mIPSCs and light-evoked cISCs (average from 8 trials) before and after visual conditioning. Calibration: left, 10 pA, 500 ms; right, 50 pA, 200 ms. B, Cumulative distribution of interevent intervals and amplitudes of mIPSCs recorded before and after the induction of depression in the cell. C, D, An example experiment (stage 45) in which potentiation of cISC was induced. Data are presented as in A and B. Calibration: left, 10 pA, 500 ms; right, 20 pA, 200 ms. E, Summary of normalized mIPSC frequency and amplitude after visual conditioning. In control experiments, no conditioning was applied. Right, Distribution of Log(E/I) values for these three sets of experiments. c, Control; d, depression; p, potentiation. **p < 0.01.
Figure 6.
Figure 6.
Electrically induced long-term depression (LTD) and long-term potentiation (LTP) of GABAergic synapses. A, An example experiment in which long-term depression of monosynaptic IPSCs was induced by TBS (4 pulses at 100 Hz in one burst, 10 bursts at 4 Hz). Electrically evoked IPSCs were sampled (Vh of 0 mV) in the presence of CNQX. Top, Average traces (from 8 trials) for IPSC before and after TBS, as well as for membrane potential response to one burst (middle). Calibration: 10 pA/10 mV, 20 ms. B, Summary of six experiments, performed in stage 41–46 tadpoles. **p < 0.01, paired t test. The white bar represents that CNQX was present throughout the experiment. C, Circles, Ratio of 1/CV2 of IPSC amplitude (after/before), plotted against the mean IPSC at 20–30 min after TBS (normalized by the mean value before TBS). Triangles and crosses, Similar analysis for control experiments when postsynaptic GABAA receptors were partially blocked by 0.2 μm bicuculline (Bic) and when release probability was reduced by applying low Ca2+ external solution (1 mm Ca2+, 3.5 mm Mg2+), respectively. D, Synaptic failure rate before and after the induction of long-term depression. *p < 0.02. E, Long-term potentiation was induced when CNQX (represented by white bars) was washed out and strong glutamatergic currents were present during TBS. Top middle trace shows the evoked excitatory current. Calibration: 20 pA, 20 ms for current; 5 mV, 50 ms for potential. F, Summary of five similar experiments, all performed in stage 45–46 tadpoles. Peak amplitude of evoked EPSC was 99.4 ± 10.2 pA in these cases. To quantify the E/I ratio, synaptic current charge within a 90 ms window was measured for the evoked EPSCs and IPSCs in the absence of CNQX. G, Ratio of 1/CV2 plotted against that of mean IPSC amplitude for electrically induced long-term potentiation (circles) and under the condition that release probability was increased by 10 mm Ca2+ (crosses). H, Paired-pulse ratio (measured as the ratio of the peak amplitude of the second response vs that of the first response) before (gray) and after (black) TBS-induced long-term potentiation and increasing external Ca2+ concentration to 10 mm. PPR is 1.55 ± 0.13 before and 1.09 ± 0.10 after LTP (p = 0.046, one-tailed paired t test) and was 1.16 ± 0.19 before and 0.77 ± 0.10 after high Ca2+ (p = 0.042). Top, Example traces for IPSC (average of 20) before (gray) and after (black) TBS-induced long-term potentiation. Calibration: 20 pA, 50 ms.
Figure 7.
Figure 7.
Presynaptic TrkB signaling is required for the induction of potentiation of cISC. A, An example experiment in which K252a was constantly present in the bath solution. Calibration: 50 pA/30 mV, 400 ms. B, Summary of experiments in which K252a was applied in the bath solution (filled symbols; n = 5) and those in which K252a was loaded into the postsynaptic cells (open symbols; n = 8). The distribution of Log(E/I) values in these experiments is shown in the inset. C, An example experiment in which the tadpole was preincubated with TrkB–IgG (2 μg/ml) for at least 1 h. Calibration: 40 pA/20 mV, 400 ms. D, Summary of six experiments with TrkB–IgG (filled symbols) and five experiments with TrkC–IgG (open symbols) preincubation.
Figure 8.
Figure 8.
BDNF causes an increase in release at developing GABAergic synapses. A, Top, Example traces of mIPSCs recorded during control period and 10 min after bath application of BDNF (100 ng/ml). Calibration: 10 pA, 500 ms. B, C, Cumulative distribution of interevent intervals and amplitudes of mIPSCs recorded in 10 min sessions before and 10 min after BDNF application in the same cell as in A. Insets in C are average mIPSCs (from 200 events) before and after BDNF application. Calibration: 2 pA, 50 ms. D, Average frequency of mIPSCs (normalized and binned with a 2 min bin size) during the course of experiments in which BDNF was applied after a 10 min control period (n = 5). The distribution of Log(E/I) values for visually evoked responses in these cells is shown on the top. *p < 0.05, paired t test. E, Normalized frequency and amplitude of mIPSCs 10–20 min after BDNF application in the normal bath solution (white bars; n = 5) and in solution containing K252a (gray bars; n = 3). *p < 0.02. F, Circles, The amplitude of monosynaptic IPSCs (electrically evoked and recorded in the presence of CNQX) was not affected after the bath application of BDNF (white bar). Squares, When TBS was applied in the presence of BDNF, IPSCs were potentiated. **p < 0.01, paired t test. G, CV analysis for BDNF-facilitated long-term potentiation (LTP) of monosynaptic IPSCs. H, PPR before (1.17 ± 0.11) and after (0.97 ± 0.04) BDNF-facilitated LTP (p = 0.039, one-tailed paired t test). Top, Example traces for IPSC (average of 20) before (gray) and after (black) LTP. Calibration: 20 pA, 50 ms.

References

    1. Aizenman CD, Manis PB, Linden DJ. Polarity of long-term synaptic gain change is related to postsynaptic spike firing at a cerebellar inhibitory synapse. Neuron. 1998;21:827–835. - PubMed
    1. Akerman CJ, Cline HT. Depolarizing GABAergic conductances regulate the balance of excitation to inhibition in the developing retinotectal circuit in vivo. J Neurosci. 2006;26:5117–5130. - PMC - PubMed
    1. Balkowiec A, Katz DM. Cellular mechanisms regulating activity-dependent release of native brain-derived neurotrophic factor from hippocampal neurons. J Neurosci. 2002;22:10399–10407. - PMC - PubMed
    1. Ben-Ari Y. Excitatory actions of gaba during development: the nature of the nurture. Nat Rev Neurosci. 2002;3:728–739. - PubMed
    1. Berretta N, Jones RS. Tonic facilitation of glutamate release by presynaptic N-methyl-d-aspartate autoreceptors in the entorhinal cortex. Neuroscience. 1996;75:339–344. - PubMed

Publication types

MeSH terms

LinkOut - more resources