Comparative Study
. 2007 May 16;27(20):5363-72.
doi: 10.1523/JNEUROSCI.0164-07.2007.

Changes in synaptic morphology accompany actin signaling during LTP

Affiliations
Comparative Study

Changes in synaptic morphology accompany actin signaling during LTP

Lulu Y Chen et al. J Neurosci. .

Abstract

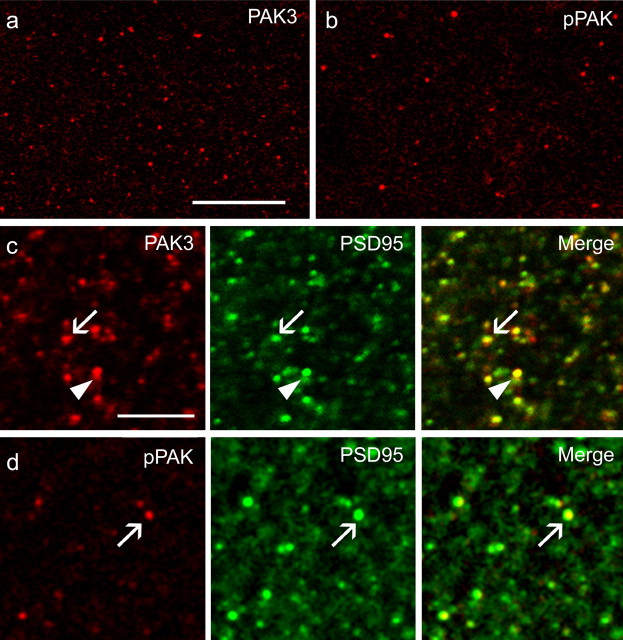
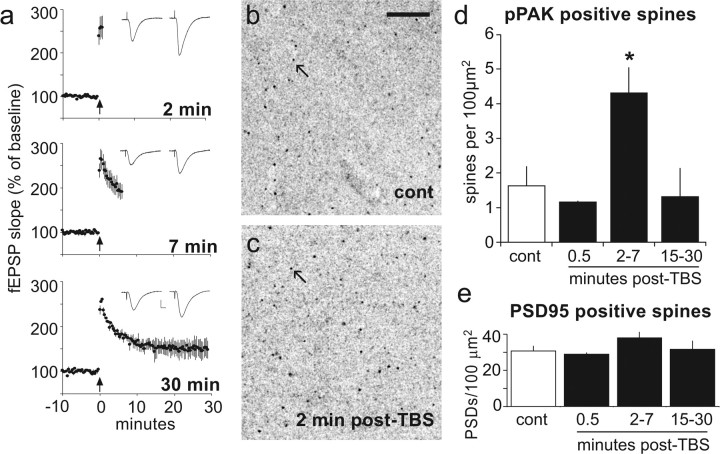
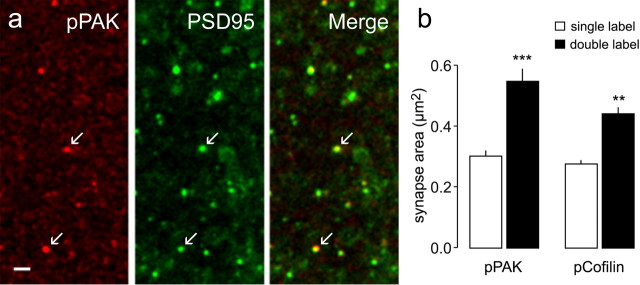
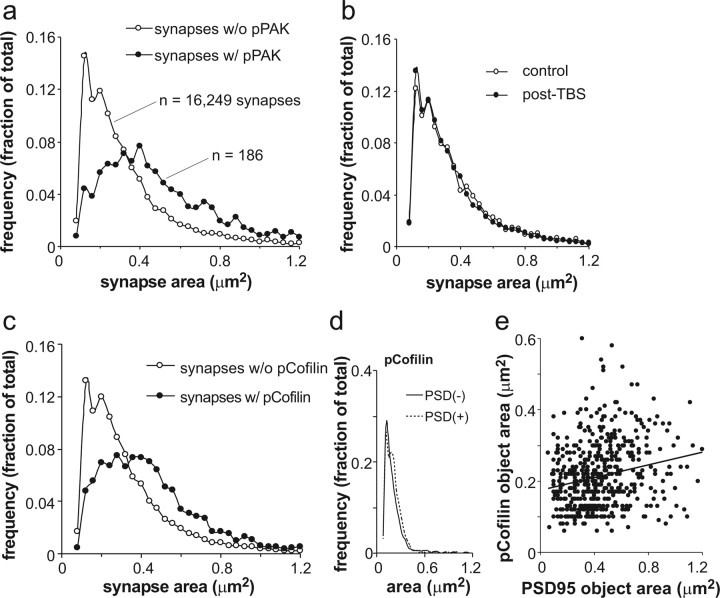
Stabilization of long-term potentiation (LTP) is commonly proposed to involve changes in synaptic morphology and reorganization of the spine cytoskeleton. Here we tested whether, as predicted from this hypothesis, induction of LTP by theta-burst stimulation activates an actin regulatory pathway and alters synapse morphology within the same dendritic spines. TBS increased severalfold the numbers of spines containing phosphorylated (p) p21-activated kinase (PAK) or its downstream target cofilin; the latter regulates actin filament assembly. The PAK/cofilin phosphoproteins were increased at 2 min but not 30 s post-TBS, peaked at 7 min, and then declined. Double immunostaining for the postsynaptic density protein PSD95 revealed that spines with high pPAK or pCofilin levels had larger synapses (+60-70%) with a more normal size frequency distribution than did neighboring spines. Based on these results and simulations of shape changes to synapse-like objects, we propose that theta stimulation markedly increases the probability that a spine will enter a state characterized by a large, ovoid synapse and that this morphology is important for expression and later stabilization of LTP.


Figures

Figure 1.
Figure 1.
Immunostaining for total and pPAK proteins in stratum radiatum of hippocampal field CA1. a, b, Laser-scanning confocal micrographs show the distributions of immunolabeling for PAK3 (a) and pPAK (b). The CA1 cell body layer is to the right (data not shown) in each micrograph. Note that dense pPAK-IR puncta are much less numerous than the comparably sized structures labeled for total PAK3 immunoreactivity. Scale bar, 10 μm. c, Confocal micrographs illustrate the distributions of PAK3 (red), PSD95 (green), and overlapped immunolabeling (yellow in Merge). PAK3-IR puncta were typically associated with dense labeling for PSD95, with the latter either capping (arrow) or overlapping (arrowhead) the PAK3 immunoreactivity. Scale bar, 5 μm. d, Confocal micrographs show profiles labeled with anti-pPAK (red) and anti-PSD95 (green) and the overlap of the two (yellow in Merge). The majority of pPAK-IR profiles were associated with PSD95 immunoreactivity. Scale bar, 5 μm.
Figure 2.
Figure 2.
Effects of theta-burst stimulation on numbers of spines with high concentrations of pPAK. a, TBS was delivered to the apical branch of the Schaffer-commissural projections and field EPSPs were recorded from the proximal apical dendrites of field CA1 in hippocampal slices from adult rats. The illustrated results are from one of two converging afferent populations used in each experiment. The traces are responses collected immediately before delivery of TBS (left side) and from the minute before the slices were collected (at right). Graphs summarize the mean (±SEM) initial slope of fEPSPs elicited by single stimulation pulses pre-TBS and post-TBS for groups of slices (n = 4/group). Calibration: 0.5 mV, 10 ms. TBS was applied at time 0 (arrow). b, c, Laser-scanning confocal micrographs showing pPAK immunostaining in slices that received either control (cont; b) or theta-burst (c) stimulation. Image intensity values are inverted to more easily observe densely labeled puncta. Note that TBS resulted in an increase in the frequency of immunoreactive spine-like puncta (arrows). Scale bar, 10 μm. d, Bar graph showing the number of pPAK+ spines in proximal str. radiatum (the recording site in a) from slices fixed 0.5 min (n = 3), 2–7 min (n = 5), or 15–30 min (n = 5) after the delivery of TBS. Control slices (open bar; n = 7) received baseline stimulation. The overall effect of time after stimulation was significant (p = 0.024, one-way ANOVA) and the 2–7 min group was significantly different from both control (*p = 0.021, Tukey's HSD) and 15–30 min post-TBS groups. E, Theta-burst stimulation did not measurably affect the total number of PSD95-IR spines in the same sections in which it increased numbers of pPAK-IR puncta (p = 0.37).
Figure 3.
Figure 3.
Effects of theta-burst stimulation on the number of spines with high concentrations of pCofilin. a, Laser confocal micrograph shows immunolabeling for total cofilin in the proximal CA1 str. radiatum. Scale bar, 5 μm. b, Micrographs showing immunostaining for pCofilin, PSD95, and the merged image of the two for the same field of CA1 str. radiatum. The pCofilin immunoreactivity (red) was localized to discrete structures that fell within the size range expected for dendritic spines. These were much less numerous than the comparable profiles (a) labeled by antisera against total cofilin. Comparison of the three panels in b shows that a subpopulation of the numerous PSD95-IR structures (green) also contained pCofilin immunoreactivity (evident as yellow puncta in the right Merge panel) and that the majority of pCofilin-IR structures were associated with concentrations of PSD95 immunoreactivity. Scale bar, 5 μm. c, Enlargement of the structure indicated by the arrowhead in b illustrates the spatial relationship of areas occupied by pCofilin (red) and PSD95 (green) immunoreactivities and the extent to which the two overlap (yellow at bottom). Scale bar, 0.25 μm. d, Three-dimensional reconstruction of immunolabeling for pCofilin (red) and PSD95 (green) structures after wide-field microscopic acquisition at 0.2 μm z-steps followed by restorative deconvolution: the adjacent but distinct localizations of pCofilin and PSD95 immunoreactivities are evident. The images are successive 90° rotations (from top to bottom). Scale bar, 0.5 μm. e, Slices were collected 30 s, 2–7 min, or 15–30 min after the delivery of a single train of TBS to the Schaffer-commissural projections and processed for pCofilin immunostaining. Controls (cont; open bar) received baseline stimulation. The marked increase in pCofilin-IR puncta at 2–7 min was highly significant (**p = 0.008, Tukey's HSD) relative to controls and 30 s post-TBS groups (n = 8 for cont and 2–7 min, n = 9 for 0.5 and 15–30 min). These results provide a close replication of those obtained with pPAK. f, Spine counts were combined within the various groups (control, 30 s post-TBS, etc.) from the separate pPAK and pCofilin experiments. Z-scores were calculated using the means and SDs for the control groups in each experiment; thus, each slice value was expressed as the difference from the mean of the control slices divided by the SD for the control slices. The planned comparisons of 2 and 7 min versus control was highly significant [ANOVA, p = 0.003, **p = 0.003, and ***p = 0.0009 for 2 (n = 7) and 7 (n = 6) min, respectively].
Figure 4.
Figure 4.
Activation of the PAK/cofilin pathway is associated with large synapses. Slices were collected 2–7 min after delivery of TBS to their Schaffer-commissural afferents. a, Micrographs show immunostaining for pCofilin (red), PSD95 (green), and the overlay image (bottom) for a slice harvested 2 min post-TBS. As shown, densely pCofilin-IR puncta (arrows, top) are associated with relatively large PSD95-IR puncta (middle). Scale bar, 1 μm. b, Bar graph summarizes the measured areas of PSD95-IR puncta that were double labeled (black bars) for pPAK immunoreactivity (left) or pCofilin immunoreactivity (right) compared with areas of elements labeled for PSD95 alone (open bars) in the same tissue sections. The differences between sizes of PSD95-IR synapses double labeled for the phosphoproteins or labeled for PSD95 immunoreactivity alone was highly significant (**p < 0.01, ***p < 0.001, paired t test vs control; n = 8 slices for both pPAK and pCofilin).
Figure 5.
Figure 5.
Size distributions differ for synapses located on pPAK- and pCofilin-positive spines compared with synapses that are not associated with a phosphoprotein labeled spine. a, Frequency distributions for areas of PSD95-IR synapses with (w/; closed circles) or without (w/o; open circles) associated pPAK immunoreactivity. These measurements were taken from the same tissue sections through slices collected 2–7 min post-TBS. The numbers of synapses used in calculating the distributions are described on the plot. PSD95-IR profiles associated with pPAK immunoreactivity were relatively infrequent. b, TBS had no detectable effects on the size distributions for postsynaptic densities that were not situated on pPAK-IR spines. c, Frequency distributions for areas of PSD95-IR synapses that were (closed circles) or were not (open circles) located on pCofilin-positive spines in slices collected 2–7 min post-TBS. Note that the results for this experiment replicate those obtained in the pPAK study (a). d, A comparison of the areas of pCofilin-IR puncta that were (dotted line) or were not (solid line) associated with PSD95 immunostaining. Unlike the reverse case (the sizes of PSD95-IR structures associated with pCofilin shown in c), the areas of pCofilin-IR elements were not affected by the presence or absence of double labeling. e, There was no correlation within the group of double-labeled structures between synapse size (PSD95-IR profiles) and the area occupied by pCofilin staining (r 2 = 0.03).
Figure 6.
Figure 6.
Size distributions of randomly oriented, simulated synapses after projection onto a two-dimensional surface. a, Average member of a group of ellipsoid, slightly concave objects used in the simulation. The semi-axes of the ellipsoids were varied according to parameters described in the text so as to produce a population of 20,000 structures that differed in size and shape. b, Average member of a group of ovoids used to simulate a second population of synapses. As with the first group, the axes of the ovoids were independently varied so as to produce a collection of objects that varied in size and shape. The mean circumference of the ovoids was the same as that for the ellipsoids. c, Distribution of areas of the projected two-dimensional images for the two populations of simulated synapses. Both populations were oriented randomly in a layer that was as thick as the longest simulated synapse and projection was made along the axis perpendicular to the layer. The mean area of the projected ovoids was 60% greater than that for the projected ellipsoids. The frequency distribution of ellipsoids approximated a Poisson, whereas that for the ovoids was more Gaussian.
Figure 7.
Figure 7.
Effects of an AMPA receptor antagonist on numbers of pCofilin-positive spines. Control and experimental slices were infused with normal aCSF or the AMPA receptor antagonist DNQX, respectively, for 55 min while baseline stimulation was delivered to the Schaffer-commissural fibers. a, Representative traces of fEPSPs collected 10 min before (−10 min) and 40 min after initiation of control or DNQX infusion. Calibration: 0.5 mV, 10 ms. b, Plot of fEPSP slopes for control slices (open circles) and experimental slices treated with DNQX (filled circles) during the interval indicated by the black bar. As shown in a and b, DNQX infusion eliminated Schaffer-commissural fEPSPs. c, Micrographs show pCofilin immunostaining in CA1 str. radiatum of a representative control slice (top) and a DNQX-treated slice harvested ∼30 min after the loss of field potentials (bottom). DNQX treatment markedly reduced the number of densely pCofilin-IR structures, although the remaining immunostaining was not qualitatively different from that found in control slices. Scale bar, 5 μm.

Similar articles

Cited by

References

    1. Aicardi G, Argilli E, Cappello S, Santi S, Riccio M, Thoenen H, Canossa M. Induction of long-term potentiation and depression is reflected by corresponding changes in secretion of endogenous brain-derived neurotrophic factor. Proc Natl Acad Sci USA. 2004;101:15788–15792. - PMC - PubMed
    1. Aoki C, Miko I, Oviedo H, Mikeladze-Dvali T, Alexandre L, Sweeney N, Bredt DS. Electron microscopic immunocytochemical detection of PSD-95, PSD-93, SAP-102, and SAP-97 at postsynaptic, presynaptic, and nonsynaptic sites of adult and neonatal rat visual cortex. Synapse. 2001;40:239–257. - PubMed
    1. Balkowiec A, Katz DM. Cellular mechanisms regulating activity-dependent release of native brain-derived neurotrophic factor from hippocampal neurons. J Neurosci. 2002;22:10399–10407. - PMC - PubMed
    1. Boda B, Alberi S, Nikonenko I, Node-Langlois R, Jourdain P, Moosmayer M, Parisi-Jourdain L, Muller D. The mental retardation protein PAK3 contributes to synapse formation and plasticity in hippocampus. J Neurosci. 2004;24:10816–10825. - PMC - PubMed
    1. Boda B, Nikonenko I, Alberi S, Muller D. Central nervous system functions of PAK protein family: from spine morphogenesis to mental retardation. Mol Neurobiol. 2006;34:67–80. - PubMed

Publication types