Comparative Study
. 2007 May 16;27(20):5414-21.
doi: 10.1523/JNEUROSCI.5347-06.2007.

Functional coupling between the prefrontal cortex and dopamine neurons in the ventral tegmental area

Affiliations
Comparative Study

Functional coupling between the prefrontal cortex and dopamine neurons in the ventral tegmental area

Ming Gao et al. J Neurosci. .

Abstract

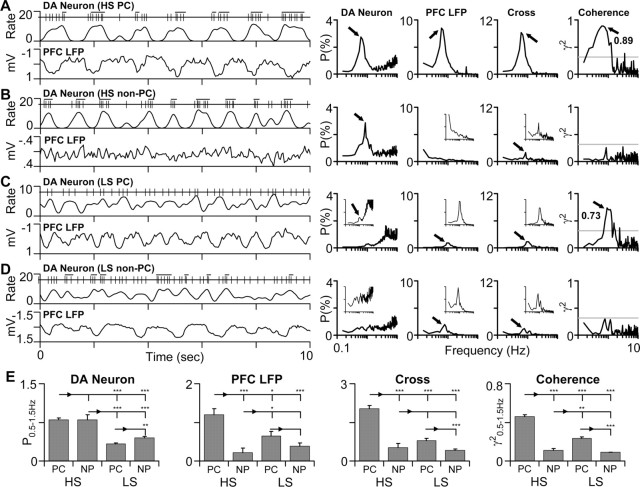
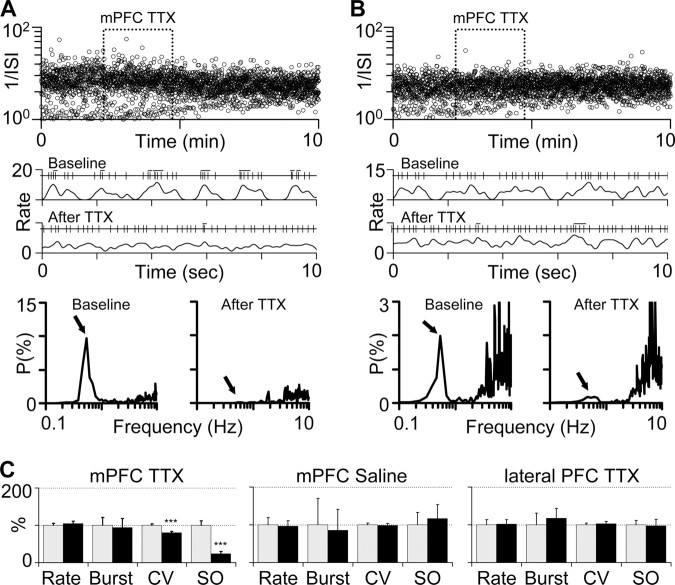
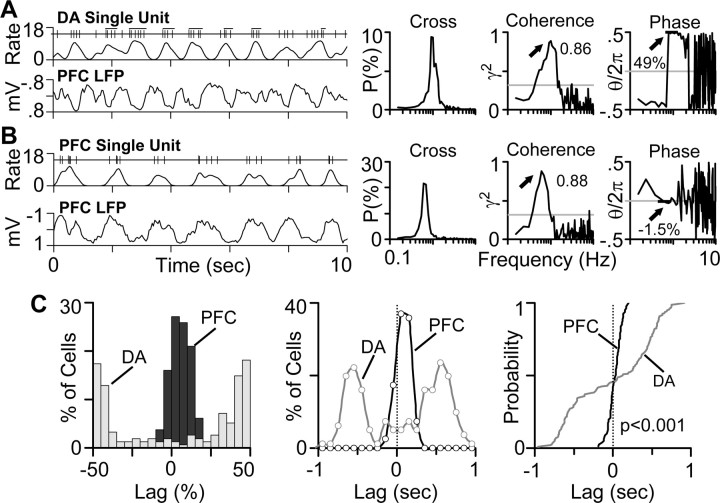
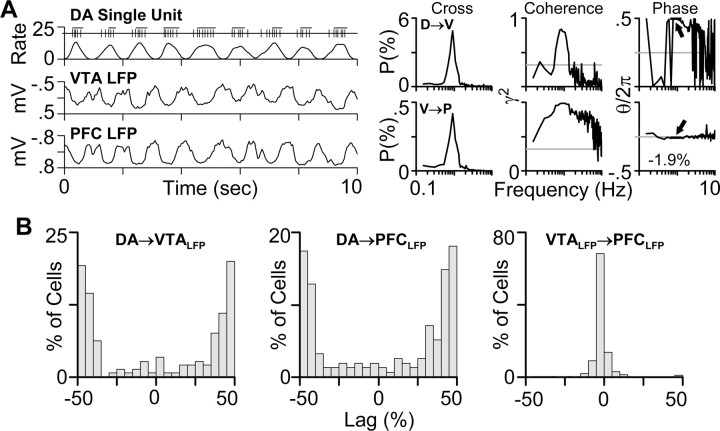
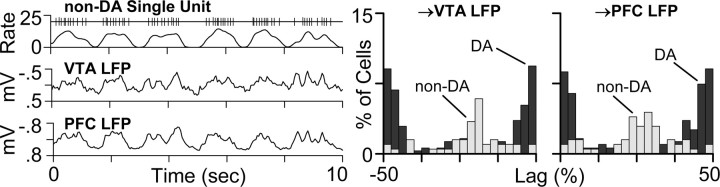
Stimulation of the prefrontal cortex (PFC) has been shown to have an excitatory influence on dopamine (DA) neurons. We report here that, under nonstimulated conditions, the activity of DA neurons in the ventral tegmental area (VTA) also covaries, on a subsecond timescale, with the activity of PFC cells. Thus, in 67% of VTA DA neurons recorded in chloral hydrate-anesthetized rats, the firing of the cell displayed a slow oscillation (SO) that was highly coherent with the activity of PFC neurons. The SO was suppressed by transections immediately caudal to the PFC or by intra-PFC infusion of tetrodotoxin, suggesting that it depends on inputs derived from the PFC. Unexpectedly, the SO in most VTA DA neurons was reversed in phase relative to PFC cell activity, suggesting that at least part of PFC information is transferred to DA neurons indirectly through inhibitory relay neurons. These results, together with those reported previously, suggest that the PFC can act through multiple pathways to exert both excitatory and inhibitory influences on DA neurons. The observed functional coupling between DA and PFC neurons further suggests that these pathways not only allow a bidirectional control of DA neurons by the PFC, but also enable action potential-dependent DA release to be coordinated, on a subsecond timescale, with glutamate release from PFC terminals. Further understanding of this coordinated activity may provide important new insights into brain functions and disorders thought to involve both VTA DA and PFC neurons.


Figures

Figure 1.
Figure 1.
Correlation between firing patterns of VTA DA neurons and PFC LFPs. A, Left, Segments of spike trains recorded from an HS, PC DA neuron, the corresponding smoothed 50 ms bin-width rate histogram, and the simultaneously recorded PFC LFPs. Bursts, defined by the “80/160 ms” criterion, are marked by the horizontal bars above the spike train. Right, The two left charts are the autospectrum of a 2 min rate histogram from the same cell and the autospectrum of the concurrently recorded PFC LFPs, respectively. The two right charts are cross and coherence spectra between the two recordings. The horizontal shaded line in the coherence spectrum is the upper limit of a 95% confidence level. Both the firing of the cell and PFC LFPs displayed an SO (0.62 Hz; arrow). Cross and coherence spectra show that the two recordings were significantly correlated, with the peak squared coherence r2 reaching 0.89 (arrow). In this and the following figures, LFP recordings are shown with the negative up. The amplitude of a spectral peak is expressed as a percentage of total power so that the sum of all peaks equals 100. B, Data from an HS non-PC neuron. The firing of this DA cell, but not the simultaneously recorded PFC LFPs, exhibited a clear SO (arrow). Cross and coherence analyses showed that the two recordings were not significantly correlated. The insets in the autospectra and cross spectra are the same spectra displayed on an expanded y-axis scale. C, Recordings from an LS PC cell. The cell was identified as an LS cell because the mean power between 0.5 and 1.5 Hz (P0.5–1.5 Hz) in its autospectrum was not significantly higher than that between 0 and 3 Hz (P0–3 Hz). A small but clear spectral peak was visible at ∼0.94 Hz (arrow). At the same frequency, the concurrently recorded PFC LFPs also displayed a small SO. Cross and coherence analyses suggest that the two recordings are correlated (r2 = 0.73). D, Results from an LS non-PC cell. The firing of this cell did not show a clear SO or a significant correlation with PFC LFPs, although the latter exhibited a clear SO (arrow). E, Bar graphs showing differences between four groups of DA neurons (HS PC, HS non-PC, LS PC, and LS non-PC) in P0.5–1.5 Hz of autospectra and cross spectra and in the mean r2 between 0.5 and 1.5 Hz (r20.5–1.5 Hz). NP, Non-PC. *p < 0.05; **p < 0.01; ***p < 0.001 (ANOVA and Tukey post hoc test).
Figure 2.
Figure 2.
Effects of intra-mPFC infusion of TTX on DA neurons. A, Top, ISI plots of a VTA DA neuron showing that TTX infusion into the PFC changed ISI distribution from bimodal (two bands) to unimodal (one band). The top band seen during baseline corresponds to ISIs within the burst-like events and the bottom band corresponds to intervals between those events. Middle, Segments of spike trains and corresponding rate histograms obtained from the same cell before and after TTX infusion. Under baseline conditions, the cell fired spikes in clusters in a rhythmic manner. After TTX infusion, the cell exhibited a more regular firing pattern. PFC TTX infusion also decreased the number of spikes occurring in bursts defined by the “80/160 ms” criterion (marked by the horizontal bars above spike trains). Bottom, Power spectra from the same cell showing the presence of an SO (arrow) before TTX infusion and its inhibition after TTX infusion. B, Results from a different VTA DA neuron showing that TTX infusion into the PFC also changed ISI distribution from bimodal to unimodal (top) and decreased the SO (middle and bottom). The infusion, however, increased the traditionally defined bursting (middle). C, Summary bar graphs showing effects of intra-mPFC TTX and saline and intralateral PFC TTX on VTA DA neurons. Shaded and solid bars represent values obtained before and after TTX infusion. All are expressed as percentage of baseline values. TTX infusion into the mPFC decreased CV and the SO. Intra-mPFC saline or intralateral PFC TTX produced no significant effects on all measures. ***p < 0.001 (paired t test).
Figure 3.
Figure 3.
Phase relationship between DA cell firing and PFC LFPs. A, Left, Segments of spike trains of a VTA DA neuron, the corresponding rate histogram, and PFC LFPs showing that the firing of the cell coincided with positive (downward) deflections in PFC LFPs. Right, Cross, coherence, and phase spectra showing that the SO in this DA cell preceded the SO in PFC LFPs by almost one half of a cycle period (49%; arrow). y-axis values in the phase spectrum are fractions of an oscillation cycle. B, Left, Segments of spike trains recorded from a PFC neuron, the corresponding rate histogram, and PFC LFPs recorded via the same electrode. Right, Cross, coherence, and phase spectra showing that the SO in this PFC neuron was nearly in-phase with respect to the SO in PFC LFPs (−1.5% of a cycle period). C, Left, Distributions of phase lags between DA cell firing and PFC LFPs (shaded bars) and between PFC cell firing and PFC LFPs (solid bars). The SO in most VTA DA neurons preceded or lagged behind the SO in PFC LFPs by >40% of an oscillation cycle. In contrast, phase lags between the SO of PFC neurons and that in PFC LFPs were all <20% of a cycle period. Values on the y-axis are percentages of cells that showed significant coherence with PFC LFPs. Center, Distributions of the same phase lags expressed in time (sec). Right, Cumulative distributions of phase lags. A Kolmogorov–Smirnov test suggests that DA and PFC neurons are significantly different in terms of their phase relationship to PFC LFPs.
Figure 4.
Figure 4.
Phase relationship between DA cell firing and VTA LFPs. A, Left, Segments of spike trains recorded from a VTA DA neuron, the corresponding rate histogram, and concurrently recorded LFPs from the VTA and PFC. Right, Cross, coherence, and phase spectra between the firing of the DA cell and VTA LFPs (D→V, top charts) and between VTA and PFC LFPs (V→P, bottom charts). As in most DA neurons, the SO in this DA cell had a nearly antiphase relationship with VTA LFPs. The latter showed a nearly in-phase relationship with PFC LFPs. B, Distributions of phase lags between DA cell firing and VTA LFPs (DA→VLFP; left), between DA cell firing and PFC LFPs (DA→PLFP; center), and between VTA and PFC LFPs (VLFP→PLFP; right). y-axis values are percentages of cells that showed significant coherence with PFC or VTA LFPs
Figure 5.
Figure 5.
Phase relationship between the firing of VTA non-DA neurons and LFPs in the VTA and PFC. Left, Segments of spike trains from a VTA non-DA neuron, the corresponding rate histogram, and concurrently recorded VTA and PFC LFPs. Unlike most DA neurons, this non-DA cell fired in synchrony with negative deflections in both VTA and PFC LFPs. Right, Distributions of phase lags between the SO of VTA non-DA neurons and that in VTA LFPs (left chart; shaded bars) and PFC LFPs (right chart; shaded bars). For comparison, data from DA neurons are also shown as solid bars. Values on the y-axis are percentages of all DA or non-DA cells recorded, including those that did not show significant coherence with VTA or PFC LFPs.

References

    1. Berger B, Thierry AM, Tassin JP, Moyne MA. Dopaminergic innervation of the rat prefrontal cortex: a fluorescence histochemical study. Brain Res. 1976;106:133–145. - PubMed
    1. Brady AM, O'Donnell P. Dopaminergic modulation of prefrontal cortical input to nucleus accumbens neurons in vivo. J Neurosci. 2004;24:1040–1049. - PMC - PubMed
    1. Bunney BS, Grace AA. Acute and chronic haloperidol treatment: comparison of effects on nigral dopaminergic cell activity. Life Sci. 1978;23:1715–1727. - PubMed
    1. Bunney BS, Walters JR, Roth RH, Aghajanian GK. Dopaminergic neurons: effect of antipsychotic drugs and amphetamine on single cell activity. J Pharmacol Exp Ther. 1973;185:560–571. - PubMed
    1. Carr DB, Sesack SR. Projections from the rat prefrontal cortex to the ventral tegmental area: target specificity in the synaptic associations with mesoaccumbens and mesocortical neurons. J Neurosci. 2000a;20:3864–3873. - PMC - PubMed

Publication types

LinkOut - more resources