. 2007 May 16;27(20):5431-6.
doi: 10.1523/JNEUROSCI.1035-07.2007.

A fast, reciprocal pathway between the lateral geniculate nucleus and visual cortex in the macaque monkey

Affiliations

A fast, reciprocal pathway between the lateral geniculate nucleus and visual cortex in the macaque monkey

Farran Briggs et al. J Neurosci. .

Abstract

Neurons in the lateral geniculate nucleus (LGN) not only provide feedforward input to primary visual cortex (V1), but also receive robust feedback from the cortex. Accordingly, visual processing in the LGN is continuously influenced by previous patterns of activity. This study examines the temporal properties of feedforward and feedback pathways between the LGN and V1 in the macaque monkey to provide a lower bound on how quickly the cortex can influence the LGN. In so doing, we identified a subclass of corticogeniculate neurons that receives direct, suprathreshold input from the LGN that is similar in latency to that directed to other recipient neurons (4.2 +/- 0.4 vs 4.0 +/- 0.2 ms). These neurons also provide feedback to the LGN that is significantly shorter in latency than that supplied by corticogeniculate neurons lacking LGN input (5.1 +/- 1.3 vs 11.1 +/- 2.3 ms, respectively). Across our sample of corticogeniculate neurons, the shortest combined visual response latency and feedback latency was 37 ms (mean, 52.5 +/- 3.8 ms), indicating that visual signals can rapidly travel from the periphery to the cortex and back to the LGN.


Figures

Figure 1.
Figure 1.
Location of stimulating electrodes and recording sites. A, Nissl-stained section of the LGN showing the track lesion from the stimulating electrode (arrow). B, Nissl-stained section of V1 showing a lesion (arrow) made at the recording site of a corticogeniculate neuron that did not receive LGN input. Dashed line represents the estimated layer 6/white matter border. D, Dorsal; L, lateral; M, medial; V, ventral.
Figure 2.
Figure 2.
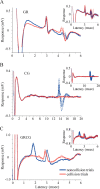
Responses of three representative cortical neurons to electrical stimulation in the LGN. In each panel, solid blue and red lines represent average responses to noncollision and collision trials, respectively (average of 12 trials; aligned to stimulus artifact at time 0). Dashed lines represent SEs. Insets show overlays of 7–10 responses. A, Responses of a GR neuron. This neuron reliably fired spikes at a latency of 2.9 ms after LGN stimulation in noncollision and collision trials. B, Responses of a CG neuron. This neuron had a latency of 13.7 ms in noncollision trials, but failed to fire spikes in collision trials. C, Responses of a GRCG neuron. This neuron fired two spikes at 1.6 and 2.8 ms in noncollision trials, but only one spike at 2.6 ms in collision trials.
Figure 3.
Figure 3.
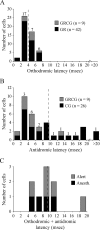
Orthodromic and antidromic latencies of V1 neurons. A, Histogram showing the distribution of orthodromic latencies for 51 geniculocortical recipient neurons: 42 GR neurons (black bars) and 9 GRCG neurons (gray bars). Numbers above each bar indicate neurons recorded in the alert animal. The mean latency for all geniculocortical recipient neurons was 4.0 ± 0.2 ms (dashed line). B, Histogram showing the distribution of antidromic latencies for 35 corticogeniculate neurons: 26 CG neurons (black bars) and 9 GRCG neurons (gray bars). Numbers above each bar indicate neurons recorded in the alert animal. The mean latency for all corticogeniculate neurons was 9.5 ± 1.7 ms (dashed line). C, Histogram showing the distribution of orthodromic plus antidromic latencies for nine GRCG neurons. Gray and black bars represent neurons recorded in alert and anesthetized animals, respectively. The mean combined latency was 9.3 ± 1.6 ms (dashed line).
Figure 4.
Figure 4.
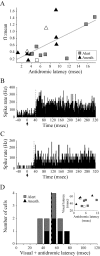
Visual physiology of corticogeniculate neurons. A, Relationship between f1:mean response and antidromic latency for 17 corticogeniculate neurons (open symbols indicate GRCG neurons). The gray line shows linear fit of the data. B, C, Peristimulus time histograms showing visual responses of a CG and GRCG neuron, respectively. Arrows indicate onset of visual stimulation. Dashed lines represent time to reach 50% of maximum response (39 and 32 ms). D, Distribution of visual response plus antidromic latencies for 11 neurons (mean latency, 52.5 ± 3.8 ms; dashed line). The inset shows the relationship between visual response latency and antidromic latency. Gray and black symbols represent neurons recorded in alert and anesthetized animals, respectively. Open symbols indicate GRCG neurons.

References

    1. Alitto HJ, Usrey WM. Corticothalamic feedback and sensory processing. Curr Opin Neurobiol. 2003;13:1–6. - PubMed
    1. Blasdel GG, Lund JS. Termination of afferent axons in macaque striate cortex. J Neurosci. 1983;3:1389–1413. - PMC - PubMed
    1. Briggs F, Usrey WM. Temporal properties of feedforward and feedback pathways between the thalamus and visual cortex in the ferret. Thalamus Relat Syst. 2005;3:133–139. - PMC - PubMed
    1. Briggs F, Usrey WM. Encyclopedia of neuroscience. Ed 4. Elsevier; 2007. Corticothalamic circuits: structure and function. in press.
    1. Bullier J, Henry GH. Ordinal position and afferent input of neurons in monkey striate cortex. J Comp Neurol. 1980;193:913–935. - PubMed

Publication types