. 2007 Aug;18(8):2779-94.
doi: 10.1091/mbc.e07-03-0274. Epub 2007 May 16.

Probing the membrane environment of the TOR kinases reveals functional interactions between TORC1, actin, and membrane trafficking in Saccharomyces cerevisiae

Affiliations

Probing the membrane environment of the TOR kinases reveals functional interactions between TORC1, actin, and membrane trafficking in Saccharomyces cerevisiae

Sofia Aronova et al. Mol Biol Cell. 2007 Aug.

Abstract

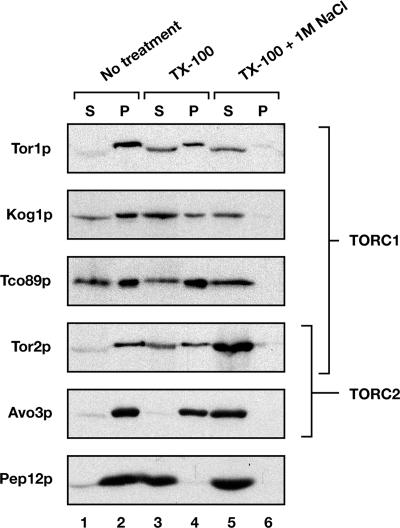
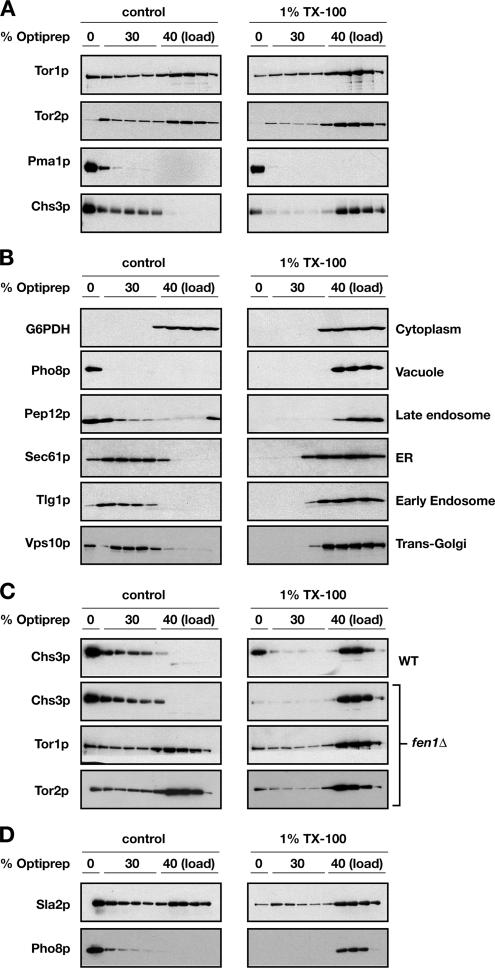
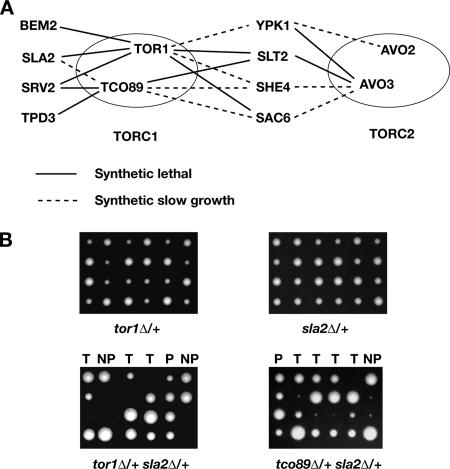
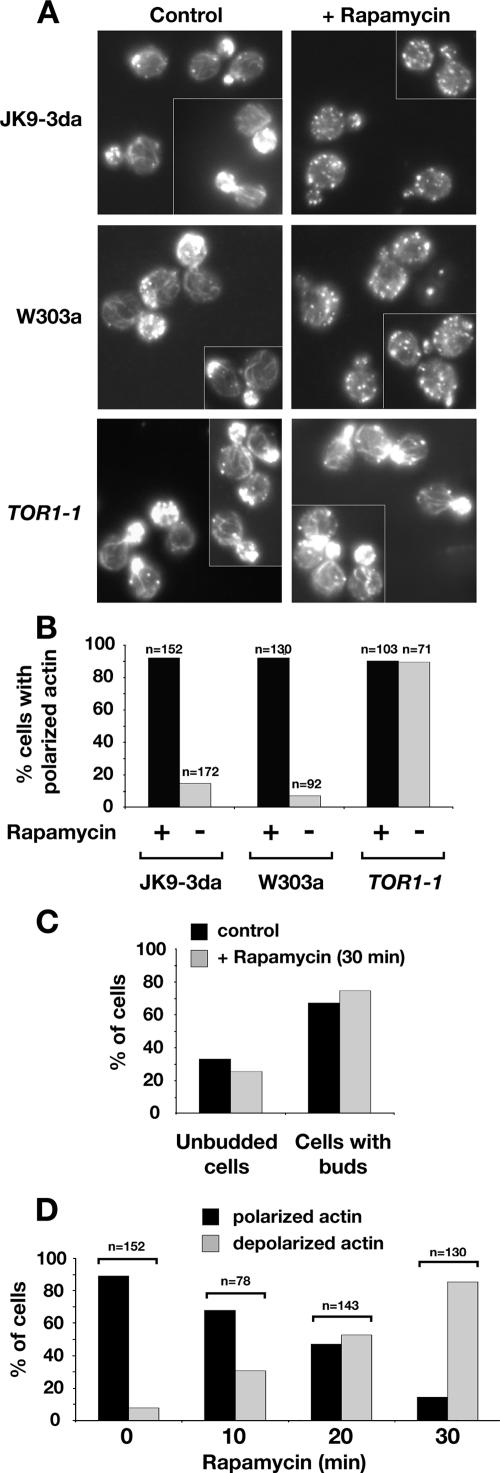
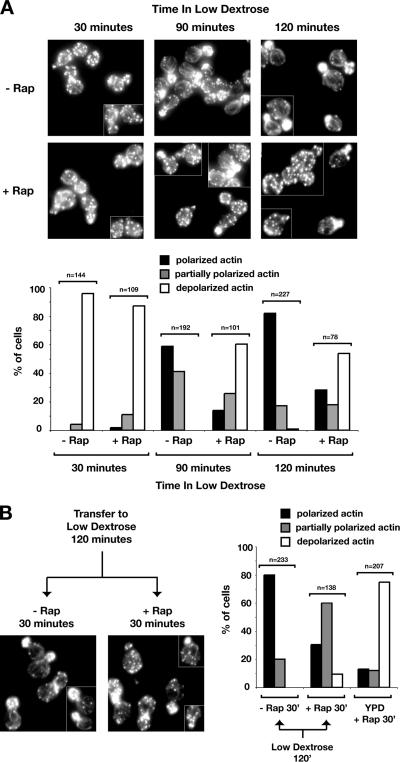
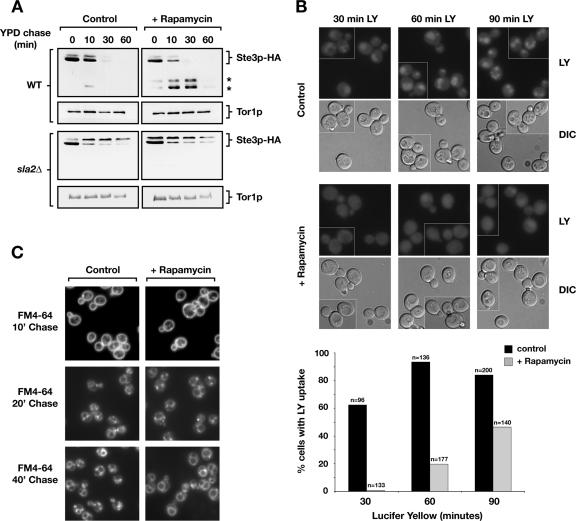
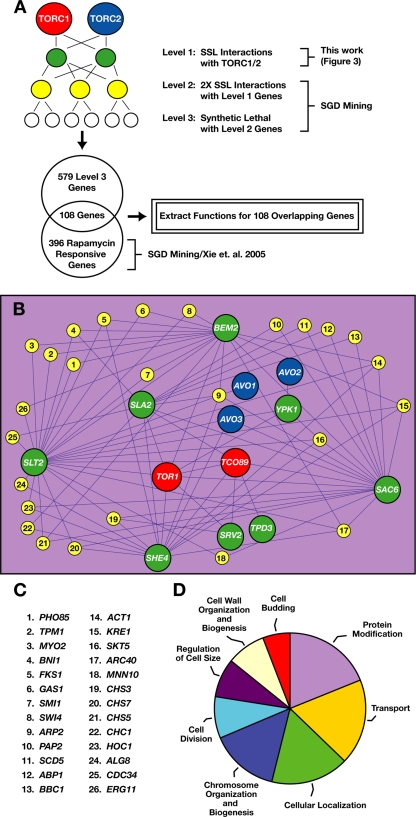
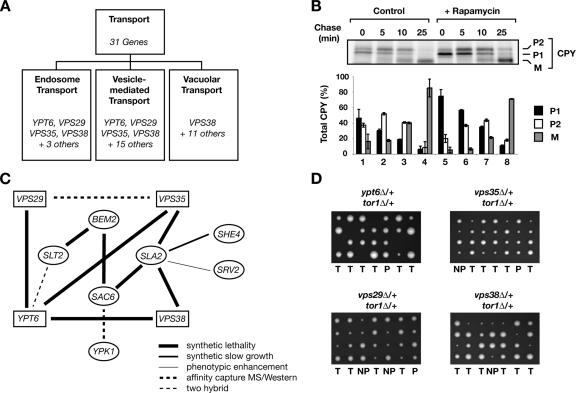
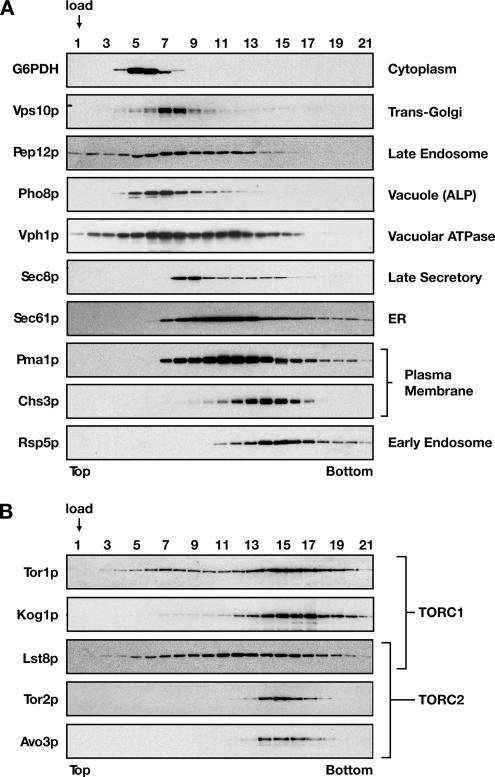
The TOR kinases are regulators of growth in eukaryotic cells that assemble into two distinct protein complexes, TORC1 and TORC2, where TORC1 is inhibited by the antibiotic rapamycin. Present models favor a view wherein TORC1 regulates cell mass accumulation, and TORC2 regulates spatial aspects of growth, including organization of the actin cytoskeleton. Here, we demonstrate that in yeast both TORC1 and TORC2 fractionate with a novel form of detergent-resistant membranes that are distinct from detergent-resistant plasma membrane "rafts." Proteomic analysis of these TOR-associated membranes revealed the presence of regulators of endocytosis and the actin cytoskeleton. Genetic analyses revealed a significant number of interactions between these components and TORC1, demonstrating a functional link between TORC1 and actin/endocytosis-related genes. Moreover, we found that inhibition of TORC1 by rapamycin 1) disrupted actin polarization, 2) delayed actin repolarization after glucose starvation, and 3) delayed accumulation of lucifer yellow within the vacuole. By combining our genetic results with database mining, we constructed a map of interactions that led to the identification of additional genetic interactions between TORC1 and components involved in membrane trafficking. Together, these results reveal the broad scope of cellular processes influenced by TORC1, and they underscore the functional overlap between TORC1 and TORC2.


Figures

Figure 1.
Figure 1.
TORC1 and TORC2 components are resistant to extraction with Triton X-100. Cell extracts were prepared from W303a-derived strains, and they were treated with 1 M NaCl and/or Triton X-100, as indicated. After centrifugation, supernatants (S) and pellets (P) were separated by SDS-PAGE, and the indicated proteins were detected by Western blot analysis. Components of TORC1 and/or TORC2 are indicated by brackets.
Figure 2.
Figure 2.
A portion of Tor1p and Tor2p associate with detergent-resistant membranes that are distinct from plasma membrane rafts. (A) Cell extracts of W303a-derived strains were treated with Triton X-100 (right) or with an equal volume of TNEX buffer (left) and subjected to 0–40% OptiPrep density gradient. Fractions were collected from the top of the gradient, and proteins were separated by SDS-PAGE. Localization of detergent-resistant fraction of Tor1p and Tor2p proteins on the gradient is clearly distinct from that of plasma membrane rafts represented by Pma1p and Chs3p markers. (B) Cell extractions and gradients were performed as described in A. Localization of the membranes associated with different organelle markers was dramatically affected by TX-100 treatment. Cytoplasmic marker Zwf1p (G6PDH) was included as a nonmembrane-associated control. (C) Cell extracts were prepared from fen1Δ strain (PLY644) as well as from the respective wild-type parent and subjected to OptiPrep gradient as described in A. Deletion of FEN1 gene, involved in sphingolipid biosynthesis, only partially affects the floatation profile of Tor1p and Tor2p, whereas the floatation of Chs3p is abolished when the extract is treated with TX-100. (D) Sla2p displays a gradient profile similar to that of the TOR proteins. Alkaline phosphatase Pho8p detected in the same experiment is shown as an example of a protein that does not associate with TX-100–resistant membranes. We note that a variable amount of Tor1p and Tor2p occurs in the 0% OptiPrep fractions, which we attribute to the difficulty in fractionation of the 0%30% interface.
Figure 3.
Figure 3.
Multiple genetic interactions between both TORC1 and TORC2 components and genes involved in actin cytoskeleton organization or/and endocytosis. (A) Genetic interactions between several components of Tor complexes and nonessential genes of proteins recovered from Tor-containing fraction by mass spectrometry for which products are involved in cytoskeleton organization or/and endocytosis. Continuous lines represent synthetic lethality, and dashed lines represent synthetic slow-growth interactions. (B) SLA2 is one of the genes that show synthetic interactions specifically with the components of TORC1. Examples of tetrad dissections of heterozygous diploids of single mutants: tor1Δ, sla2Δ as well as those double mutants: tor1Δ sla2Δ and tco89Δ sla2Δ. Note that tor1Δ is synthetically lethal with sla2Δ, whereas tco89Δ displays a synthetic slow growth defect with sla2Δ. T, tetratype; P, parental ditype; NP, nonparental ditype.
Figure 4.
Figure 4.
Actin cytoskeleton organization is rapidly affected by specific inhibition of TORC1 by rapamycin and its reorganization may be part of the starvation response. (A) Distribution of polymerized actin upon rapamycin treatment in wild-type strains of W303a and Jk9-3da backgrounds and in a strain that carries rapamycin insensitive TOR1-1 allele (JH1-11c). Cells were grown in YPD and treated either with rapamycin or dimethyl sulfoxide (DMSO) for 30 min. Cells were fixed, stained with rhodamine-phalloidin, and visualized by fluorescence microscopy as described in Materials and Methods. All fluorescence images are Z-series stacks of eight to 12 0.2-μm steps projected to a single plane. (B) Percentage of small- and midsize-budded cells that display polarized distribution of actin upon rapamycin treatment in the experiment shown in A. (C) Depolarization of the actin cytoskeleton is not a secondary effect of a cell cycle arrest, because the percentage of unbudded cells does not change within 30 min of rapamycin treatment. Wild-type Jk9-3da cells were grown to early log phase, treated with rapamycin, and processed as described in A. (D) Time course of depolarization of the actin cytoskeleton upon rapamycin treatment. Wild-type Jk9-3da cells were treated with rapamycin for the amount of time indicated and processed as described in A.
Figure 5.
Figure 5.
Remodeling of actin cytoskeleton in response to glucose starvation. (A) Rapamycin treatment significantly diminishes repolarization of the actin cytoskeleton that occurs after a shift of cells from high to low dextrose-containing media. Wild-type Jk9-3da cells were grown in rich YPD medium and pretreated with rapamycin or DMSO for 30 min before the shift to YPD containing 0.05% glucose for the time indicated. (B) Rapamycin treatment does not significantly perturb the actin cytoskeleton once it is remodeled after transfer to low glucose conditions. Cells were shifted from high (2%) to low (0.05%) glucose medium for 120 min in the absence of rapamycin, followed by either rapamycin or DMSO treatment for an additional 30 min.
Figure 6.
Figure 6.
Rapamycin delays fluid phase endocytic trafficking of lucifer yellow to the vacuole as well as degradation but not internalization of Ste3p-HA. (A) Wild-type and sla2Δ cells carrying plasmid pGAL-STE3-HA were grown overnight in medium containing 2% galactose to induce STE3-HA expression, and they were treated with rapamycin or DMSO for 30 min. After a shift to YPD, aliquots were removed at indicated times, and proteins were extracted and analyzed by Western blotting to detect Ste3p-HA. The star symbol indicates presumed degradation intermediates of Ste3p-HA. (B) LY trafficking to the vacuole is delayed upon rapamycin treatment of wild-type strain (LHY291). Cells were grown in YPD to OD600 = 0.3–0.5, and they were either treated with rapamycin or DMSO. Cells were processed as described in Materials and Methods, and they were incubated with LY at 30°C for the indicated minutes. Quantification for this experiment is shown below. (C) Bulk membrane flow rate is not affected by rapamycin treatment as assayed by staining with the lipophilic dye FM4-64. Cells were grown overnight in YPD, treated with rapamycin or DMSO for 30 min, and further processed as described previously (Vida and Emr, 1995).
Figure 7.
Figure 7.
Network of genetic interactions involving TORC1 components and genes implicated in cytoskeleton organization. (A) Diagram of different levels of genetic interactions involving TORC1 used to extract functions and/or pathways that are interdependent with actin–cytoskeleton components. LEVEL 3 genes were filtered through the list of rapamycin-responsive genes (Xie et al., 2005) where individual gene deletions display rapamycin-hypersensitive or resistant phenotypes. Filtering was performed using a Perl script developed in our laboratory (available upon request). Gene functions (standardized GO terms) were extracted using the Gene Ontology tool (GO_term finder) available through the SGD (http://db.yeastgenome.org/cgi-bin/GO/goTermFinder). (B) Network of genetic interactions was built using Cytoscape 2.1 software (http://www.cytoscape.org) by using manual alterations. Nodes and connecting edges denote genes and their genetic interactions, respectively. Red and blue nodes specify components of TORC1and TORC2, respectively. Green nodes (LEVEL 1 genes) represent genes encoding proteins recovered from TOR-DRMs that displayed SSL interactions with TORC1 and/or TORC2 genes. Yellow nodes (LEVEL 2 genes) depict genes that display two or more SSL interactions with LEVEL 1 genes. (C) List of LEVEL 2 genes depicted in B. (D) Diagram of pathways extracted from our network of genetic interactions as described in A. The transport function is shown in detail in Figure 8A. GO terms were clustered based on hierarchical tree of GO biological process annotations.
Figure 8.
Figure 8.
Genetic interactions network suggests a link between TORC1 and vesicular trafficking. (A) Detailed representation of the Transport function that is part of the diagram shown in Figure 7D. YPT6, VPS29, VPS35, and VPS38 genes fall into multiple subcategories related to transport. (B) CPY trafficking is delayed upon rapamycin treatment. Wild-type W303a cells were grown in SCD medium lacking methionine and cysteine, treated with DMSO or rapamycin for 30 min, and then metabolically labeled with [35S]methionine/cysteine for 10 min and chased in the presence of the excess of cold methionine/cysteine at 30°C for the indicated minutes. Proteins were immunoprecipitated using α-CPY antibodies, resolved on SDS-PAGE, and analyzed using a PhosphorImager. Quantification of data for three independent experiments is shown, where black bars denote ER precursor (P1), white bars denote Golgi-modified forms (P2), and gray bars denote mature (M) forms of CPY. Error bars denote standard deviations. (B) Network of genetic and physical interactions (derived from SGD) that link highly represented genes in the transport category (squares) with LEVEL 1 genes (ovals). (C) TOR1 genetically interacts with highly represented genes in the transport category. tor1Δ is synthetically lethal with deletion of YPT6, and displays synthetic slow growth interactions with VPS29, VPS35, and VPS38 genes as shown by tetrad dissection of respective heterozygous diploids. The plate combining tor1 and ypt6 deletions was incubated at 32°C, whereas plates combining tor1 and vps deletions were incubated at 30°C.
Figure 9.
Figure 9.
Cofractionation of TORC1 and TORC2 components on sorbitol overlay gradients. Cell extracts were prepared from W303a-derived strains and subjected to sorbitol overlay gradients, as described in Materials and Methods. After centrifugation, gradients were fractionated and analyzed by SDS-PAGE followed by Western blot analysis, probing either for representative marker proteins for different secretory and endocytic membrane compartments (A) or representative components of TORC1 and/or TORC2, as indicated (B).

References

    1. Araki T., Uesono Y., Oguchi T., Toh E. A. LAS24/KOG1, a component of the TOR complex 1 (TORC1), is needed for resistance to local anesthetic tetracaine and normal distribution of actin cytoskeleton in yeast. Genes Genet. Syst. 2005;80:325–343. - PubMed
    1. Audhya A., Loewith R., Parsons A. B., Gao L., Tabuchi M., Zhou H., Boone C., Hall M. N., Emr S. D. Genome-wide lethality screen identifies new PI4,5P2 effectors that regulate the actin cytoskeleton. EMBO J. 2004;23:3747–3757. - PMC - PubMed
    1. Bagnat M., Keranen S., Shevchenko A., Shevchenko A., Simons K. Lipid rafts function in biosynthetic delivery of proteins to the cell surface in yeast. Proc. Natl. Acad. Sci. USA. 2000;97:3254–3259. - PMC - PubMed
    1. Berven L. A., Willard F. S., Crouch M. F. Role of the p70(S6K) pathway in regulating the actin cytoskeleton and cell migration. Exp. Cell Res. 2004;296:183–195. - PubMed
    1. Brachmann C. B., Davies A., Cost G. J., Caputo E., Li J., Hieter P., Boeke J. D. Designer deletion strains derived from Saccharomyces cerevisiae S288C: a useful set of strains and plasmids for PCR-mediated gene disruption and other applications. Yeast. 1998;14:115–132. - PubMed

Publication types

MeSH terms