. 2007 Aug;18(8):2864-72.
doi: 10.1091/mbc.e06-12-1069. Epub 2007 May 16.

Ets-2 repressor factor silences extrasynaptic utrophin by N-box mediated repression in skeletal muscle

Affiliations

Ets-2 repressor factor silences extrasynaptic utrophin by N-box mediated repression in skeletal muscle

Kelly J Perkins et al. Mol Biol Cell. 2007 Aug.

Abstract

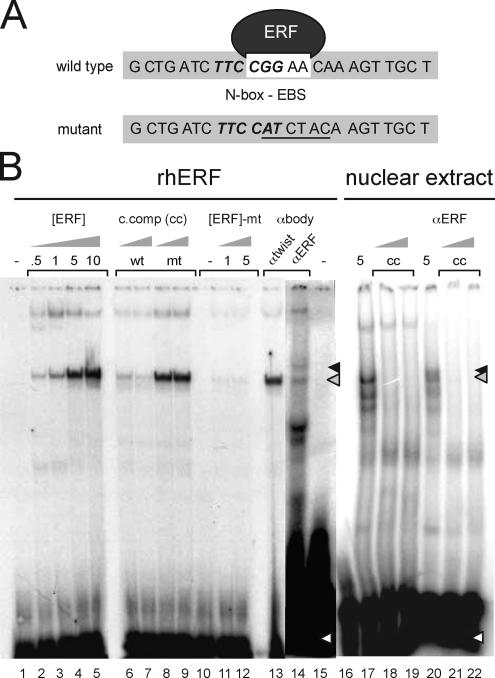
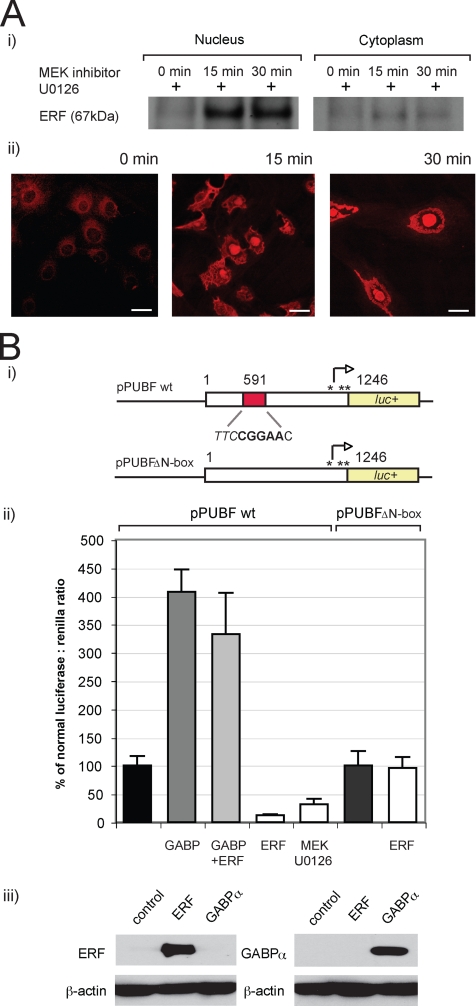
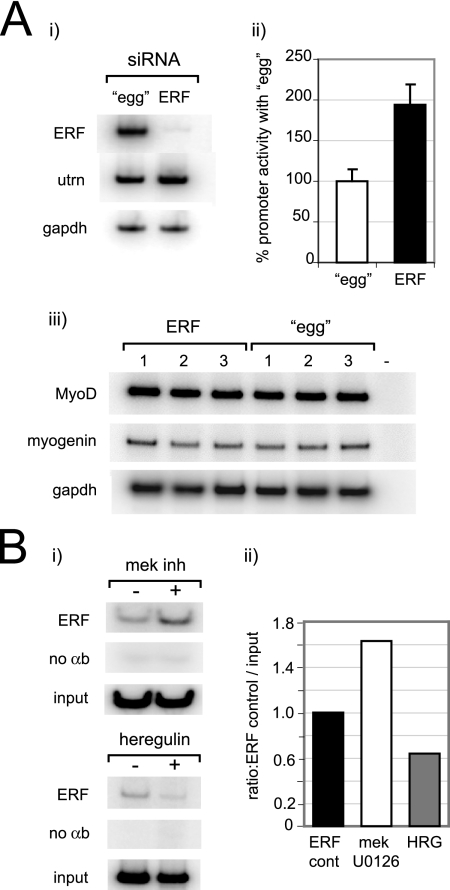
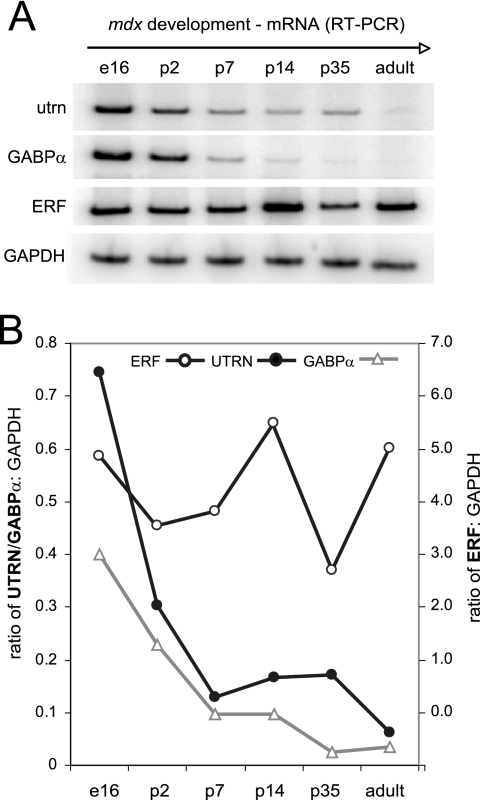
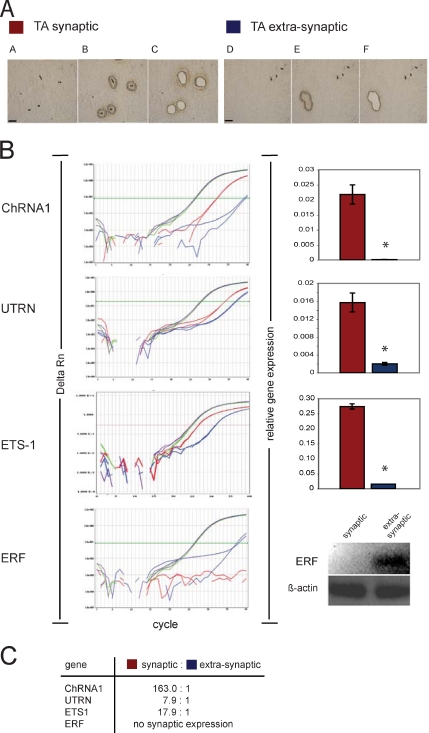
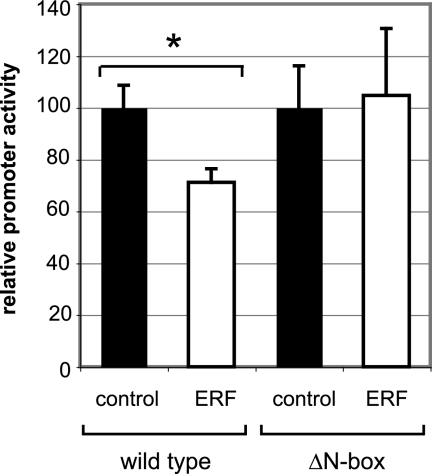
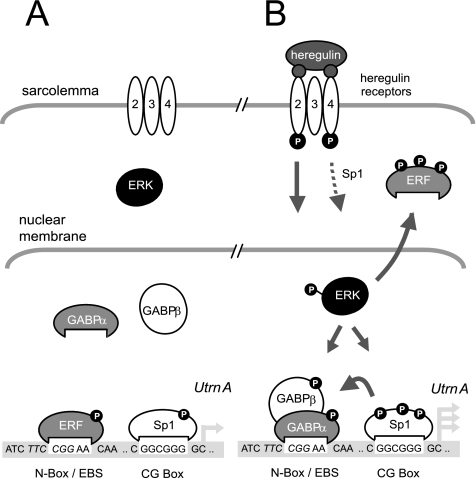
Utrophin is the autosomal homologue of dystrophin, the protein product of the Duchenne's muscular dystrophy (DMD) locus. Utrophin expression is temporally and spatially regulated being developmentally down-regulated perinatally and enriched at neuromuscular junctions (NMJs) in adult muscle. Synaptic localization of utrophin occurs in part by heregulin-mediated extracellular signal-regulated kinase (ERK)-phosphorylation, leading to binding of GABPalpha/beta to the N-box/EBS and activation of the major utrophin promoter-A expressed in myofibers. However, molecular mechanisms contributing to concurrent extrasynaptic silencing that must occur to achieve NMJ localization are unknown. We demonstrate that the Ets-2 repressor factor (ERF) represses extrasynaptic utrophin-A in muscle. Gel shift and chromatin immunoprecipitation studies demonstrated physical association of ERF with the utrophin-A promoter N-box/EBS site. ERF overexpression repressed utrophin-A promoter activity; conversely, small interfering RNA-mediated ERF knockdown enhanced promoter activity as well as endogenous utrophin mRNA levels in cultured muscle cells in vitro. Laser-capture microscopy of tibialis anterior NMJ and extrasynaptic transcriptomes and gene transfer studies provide spatial and direct evidence, respectively, for ERF-mediated utrophin repression in vivo. Together, these studies suggest "repressing repressors" as a potential strategy for achieving utrophin up-regulation in DMD, and they provide a model for utrophin-A regulation in muscle.


Figures

Figure 1.
Figure 1.
ERF binds to the utrophin-A promoter N-box/EBS element. (A) Sequence of the human utrophin-A promoter probes containing the N-box/EBS motif used in gel shifts. The N-box is in bold italics; the EBS is in a white box. Mutant refers to the gel shift probe used that contains a mutant N-box/EBS site. (B) The N-box/EBS site in the human utrophin A promoter binds ERF. rhERF was in vitro synthesized and 0.5–10 μl (0.5–10; lanes 2–5) was incubated with the labeled oligonucleotide probe. Five microliters each of C2C12 extract was used for analysis of endogenous ERF in lanes 17–22. Formation of a single specific DNA–protein complex (gray arrow) was observed with rhERF (lanes 2–5), which could be specifically competed away with 10- and 100-fold excess of wild-type cold competitor oligonucleotide (lanes 6 and 7) but not the mutant probe (lanes 8 and 9). rhERF did not bind a double-stranded probe of the same region with a mutated N-box/EBS site (lanes 10–12). The black arrow indicates ERF–DNA complex supershifted in the presence of 5 μl of ERF-specific antibodies (lane 14) but not in the presence of a nonspecific antibody against the transcription factor Twist (lane 13). White arrows represent free radiolabeled probe. Wt, wild-type probe; mt, N-box/EBS mutant probe; [ERF], amount of rhERF protein in microliters; c, comp, unlabeled N-box/EBS oligonucleotide; αERF, ERF S17C rabbit polyclonal antibody.
Figure 2.
Figure 2.
The human utrophin-A promoter is trans-repressed by ERF overexpression and MEK inhibition, which may be alleviated by GABPα/β. (A) Changes in subcellular fractions and subcellular localization of ERF protein in C2C12 cells caused by inhibition of MEK by using U1026. Nuclear shuttling of ERF noted over a 30-min treatment period as demonstrated by i) immunoblotting or ii) immunofluorescence by using anti-ERF antibodies, as described in Materials and Methods. Bar, 25 μm. (B) The human utrophin-A promoter is trans-repressed by ERF overexpression and MEK inhibition, which may be alleviated by GABPα/β. (i) The 1.3-kb human utrophin-A promoter-luciferase construct pPUBF showing location of the N-box/EBS according to X95523. The pPUBFΔN-box construct has a deletion that removes the N-box/EBS. (ii) pPUBF or pPUBFΔN-box derived firefly luciferase activities were normalized to pRL-TK-derived Renilla luciferase activity and expressed as a percentage of normalized luciferase activity (black column). Utrophin promoter-reporter constructs and a transfection control pRL-TK vector were cotransfected into S2 cells along with equimolar combinations of the following: GABPα/β expression vectors (GABP, gray columns), ERF expression vector pSG5-ERF (ERF, white columns), GABPα/β and ERF vectors (light gray column), or a 10 μM final concentration of MEK inhibitor UO126 (white column), and luciferase activity was assayed after a 24-h incubation. GABPα/β trans-activated the utrophin promoter construct almost fourfold (gray column), whereas decreases to 12 and 33% of normalized promoter activity was noted with ERF overexpression and MEK inhibition, respectively. However, trans-repression by ERF was completely competed by GABPα/β trans-activation (light gray column). No difference in pPUBFΔN-box reporter activity was observed upon the addition of ERF (96%). Luciferase values are the means of triplicate wells in nine separate experiments (n = 27) for pPUBF and ERF and in three separate experiments (n = 9) for MEK inhibition and GABPα/β. Error bars are SEM. (iii) Immunoblot controls showing that transfection of GABP and ERF expression vectors causes an increase in protein levels in transfected C2C12 cells.
Figure 3.
Figure 3.
Inhibition of ERF gene expression enhances utrophin mRNA levels and utrophin-A promoter activity in C2C12 cells. (Ai) Semiquantitative RT-PCR of ERF, utrophin, and GAPDH transcript levels in murine C2C12 cells after treatment with either 100 pmol (left lane) of an unrelated, scrambled control egg oligomer, or 25 nmol each of four siRNA complementary to ERF. ERF siRNA oligomers caused a specific decrease in ERF transcript to ∼2% and an ∼1.4-fold increase in utrophin mRNA after adjustment to GAPDH levels. (ii) ERF knockdown causes an increase in utrophin promoter activity. The pPUBF utrophin promoter-luciferase construct was transfected into C2C12 cells 24 h after either egg or ERF siRNA oligomer transfection, and luciferase activity was assayed after an additional 24-h incubation. An approximate twofold elevation of utrophin promoter activity in C2C12 cells was observed with the ERF oligomer mix (1.99 ± 0.24) in comparison with the egg scrambled control. Luciferase values are the means of four separate experiments performed in triplicate (n = 12). Error bars are SEM. (iii) Semiquantitative RT-PCR of MyoD, myogenin, and GAPDH transcript levels in murine C2C12 cells after treatment with either 25 nmol each of four siRNA complementary to ERF (left lanes, 1–3) or 100 pmol (right lanes, 1–3) of an unrelated, scrambled control egg oligomer and assayed after 24 h. The − marked lane shows a negative control for RT-PCR where reaction was performed without template. No significant changes in MyoD or myogenin transcript levels were noted. Gels show results of three separate experiments. (B) Chromatin immunoprecipitation analysis of the utrophin-A promoter with ERF antibodies in C2C12 cells, demonstrating changes in ERF occupancy of the utrophin-A promoter upon treatment with MEK inhibitor U0126 and HRG treatment for 15 min. (i) RT-PCR of utrophin-A promoter from ERF-precipitated chromatin from C2C12 cells. (ii) Quantification of changes in ERF occupancy compared with the untreated ERF controls shows increased (1.63-fold) and decreased (0.64-fold) ERF levels with MEK inhibitor U0126 and HRG, respectively. Controls incubated without antibodies are shown below.
Figure 4.
Figure 4.
Transcript levels of GABPα, utrophin, and ERF in mdx mouse muscle. Semiquantitative RT-PCR of utrophin, GABPα, ERF, and control GAPDH transcript levels at various times from embryonic day 16 to adult (12-mo-old) muscle. Utrophin and GABPα transcripts are shown after a 48-h exposure, and GAPDH and ERF are shown after 24-h exposure. The graph illustrates arbitrary units of each PCR product measured by ImageQuant Tool software and expressed as a ratio to GAPDH at each time point after 24-h exposure. Left y-axis refers to ratios to GAPDH obtained for utrophin and GABPα, and right y-axis refers to ERF:GAPDH ratios. E, embryonic; p, perinatal.
Figure 5.
Figure 5.
ERF expression is restricted exclusively to extrasynaptic regions in muscle, suggesting a role in utrophin repression. (A) Microdissection steps of synaptic and extrasynaptic regions of rat TA muscle. Cryosections of 10 μm (TA) are stained with Karnowsky and Root's method to show NMJ localization by using PEN membrane glass slides, and they are visualized using PALM light microscopy at 20× power. (A and D) Visualization of TA tissue before LCM. (B and E) Same slide cut by laser for synaptic and nonsynaptic tissue parts intending to capture. (C and F) Section visualized post-LCM, showing removal of synaptic and nonsynaptic material by catapulting to the extraction buffer. Bars, 100 μm. (B) Taqman qRT-PCR amplification plots of Chrna1 (muscle), Utrn, Ets1, Erf, and β-actin are shown on the left side of Figure 5B. The x-axis shows PCR cycle numbers up to 40, and the y-axis illustrates the Δ of normalized reporter fluorescence dye (ΔRn), which refers to new product formation in each cycle. Color codes used refer to β-actin in TA-synaptic (purple) and TA-nonsynaptic (green) and the gene of interest in TA-synaptic (red) and TA-nonsynaptic (blue) in PCR analysis. Relative gene expression of analysis data results for duplicate wells of each gene are shown as bar graphs with standard deviations, with a star indicating statistically significant differences. Because ERF (blue lines) did not reach threshold levels in this analysis, its expression level is illustrated as an electrophoretic agarose (1%) gel product at the end of 40 cycles. (C) Summary of the relative expression synaptic:nonsynaptic ratio for all genes is illustrated.
Figure 6.
Figure 6.
Direct gene transfer demonstrates N-box–mediated utrophin-A promoter repression by ERF in vivo. Utrophin promoter-A constructs (wild type; with N-box) were coinjected with CAT (to monitor transduction efficiency) into TA muscles of 4-wk-old control mice with control (pSG5 vector) or ERF (pSG5-ERF) expression plasmid. A different cohort was injected using the mutant utrophin promoter constructs (ΔN-box; without N-box). Five days later, muscles were harvested, and then RNA extracted and qPCR analysis was performed. Values obtained for LacZ or luciferase are standardized relative to the amount of CAT present in the same sample, with the ERF-injected samples compared with their respective control (normalized to 100%). Student's t tests were used to analyze the data. The asterisk denotes the statistically significant (p < 0.02) decrease in promoter-A activation (∼30%) observed with the ERF plasmid (black bar) versus the control injected plasmid (white bar). No significant differences were observed using the ΔN-box construct. Error bars represent SEM; sample size for wild type, n = 5; ΔN-box, n = 10 for both ERF and control experiments.
Figure 7.
Figure 7.
Model for transcriptional regulation of utrophin promoter- A via the N-box/EBS site in muscle. Transcriptional model of the utrophin-A promoter pre- and post-ERK nuclear localization by HRG stimulation at the NMJ. Multiple arrows represent increased transcription. P, phosphorylated protein; dotted and full arrowed lines represent potential and defined signaling cascades, respectively. For more information, please refer to the text.

Similar articles

Cited by

References

    1. Andres M. E., Burger C., Peral-Rubio M. J., Battaglioli E., Anderson M. E., Grimes J., Dallman J., Ballas N., Mandel G. CoREST: a functional corepressor required for regulation of neural-specific gene expression. Proc. Natl. Acad. Sci. USA. 1999;96:9873–9878. - PMC - PubMed
    1. Ballas N., et al. Regulation of neuronal traits by a novel transcriptional complex. Neuron. 2001;31:353–365. - PubMed
    1. Budak M. T., Bogdanovich S., Wiesen M. H., Lozynska O., Khurana T. S., Rubinstein N. A. Layer-specific differences of gene expression in extraocular muscles identified by laser-capture microscopy. Physiol. Genomics. 2004;20:55–65. - PubMed
    1. Burton E. A., Tinsley J. M., Holzfeind P. J., Rodrigues N. R., Davies K. E. A second promoter provides an alternative target for therapeutic up-regulation of utrophin in Duchenne muscular dystrophy. Proc. Natl. Acad. Sci. USA. 1999;96:14025–14030. - PMC - PubMed
    1. Cerletti M., et al. Dystrophic phenotype of canine X-linked muscular dystrophy is mitigated by adenovirus-mediated utrophin gene transfer. Gene Ther. 2003;10:750–757. - PubMed

Publication types

MeSH terms