. 2007 Aug;18(8):2838-51.
doi: 10.1091/mbc.e06-09-0875. Epub 2007 May 16.

E-cadherin inhibits cell surface localization of the pro-migratory 5T4 oncofetal antigen in mouse embryonic stem cells

Affiliations

E-cadherin inhibits cell surface localization of the pro-migratory 5T4 oncofetal antigen in mouse embryonic stem cells

Helen L Spencer et al. Mol Biol Cell. 2007 Aug.

Abstract

Epithelial-mesenchymal transition (EMT) events occur during embryonic development and are important for the metastatic spread of epithelial tumors. We show here that spontaneous differentiation of mouse embryonic stem (ES) cells is associated with an E- to N-cadherin switch, up-regulation of E-cadherin repressor molecules (Snail and Slug proteins), gelatinase activity (matrix metalloproteinase [MMP]-2 and -9), and increased cellular motility, all characteristic EMT events. The 5T4 oncofetal antigen, previously shown to be associated with very early ES cell differentiation and altered motility, is also a part of this coordinated process. E- and N-cadherin and 5T4 proteins are independently regulated during ES cell differentiation and are not required for induction of EMT-associated transcripts and proteins, as judged from the study of the respective knockout ES cells. Further, abrogation of E-cadherin-mediated cell-cell contact in undifferentiated ES cells using neutralizing antibody results in a reversible mesenchymal phenotype and actin cytoskeleton rearrangement that is concomitant with translocation of the 5T4 antigen from the cytoplasm to the cell surface in an energy-dependent manner. E-cadherin null ES cells are constitutively cell surface 5T4 positive, and although forced expression of E-cadherin cDNA in these cells is sufficient to restore cell-cell contact, cell surface expression of 5T4 antigen is unchanged. 5T4 and N-cadherin knockout ES cells exhibit significantly decreased motility during EMT, demonstrating a functional role for these proteins in this process. We conclude that E-cadherin protein stabilizes cortical actin cytoskeletal arrangement in ES cells, and this can prevent cell surface localization of the promigratory 5T4 antigen.


Figures
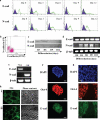
Figure 1.
Figure 1.
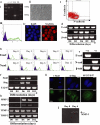
Mouse ES cell spontaneous differentiation is associated with loss of cell surface E-cadherin protein and gain of cell surface N-cadherin protein. MESC20 ES cells were maintained in an undifferentiated state by culture in ES cell medium containing LIF and differentiated in synthetic serum in the absence of LIF in monolayer culture. (a) Cell surface E-cadherin (E-cad) and N-cadherin (N-cad) proteins were assessed in undifferentiated MESC20 ES cells (day 0) and differentiated cells for 3, 6, 9, and 12 d by fluorescent flow cytometry in a Becton-Dickinson FACScaliber. E- or N-cadherin, open population; isotype control antibodies, closed population. (b) Fluorescent flow cytometry dual staining for E- and N-cadherin on MESC20 ES cells differentiated for 3 d as described above. (c) Western blot was performed to assess total cellular E- (E-cad) or N-cadherin (N-cad) proteins in MESC20 ES cells differentiated for 3, 6, 9, and 12 d as described above. (d) RT-PCR analysis of E- (E-cad) and N-cadherin (N-cad) and β-tubulin (β-tub; control) transcript expression was assessed in undifferentiated MESC20 ES cells (day 0) and in cells differentiated for 3, 6, 9, and 12 d as described above. (e) MESC20 ES cells were differentiated for 3 d as described above and E-cadherin–positive (+ve) and E-cadherin–negative (−ve) cells isolated by FACS. RT-PCR was performed on the samples to assess E- (E-cad) and N-cadherin (N-cad) and β-tubulin (β-tub) transcript expression. (f) Immunofluorescence microscopy analysis of total cells (DAPI) and E-cadherin (E-cad) and OCT-4 protein expression in undifferentiated MESC20 ES cells. Bar, 10 μm. (g) MESC20 ES cells were differentiated for 4 d and assessed for total cells (DAPI) and E-cadherin (E-cad) and OCT-4 protein expression using immunofluorescent microscopy. Bar, 10 μm. (h) ES cells were cultured in FCS+LIF (i) and FCS−LIF (ii) for 2 d and 5T4 antigen expression assessed using fluorescent microscopy and phase-contrast microscopy.
Figure 2.
Figure 2.
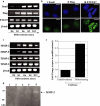
Mouse ES cell differentiation is associated with nuclear localization of the E-cadherin repressor proteins Snail and Slug, matrix metalloproteinase activity, and increased motility. Undifferentiated and differentiating MESC20 ES cells were cultured as described in the legend to Figure 1. (a) Transcript expression of Snail, Slug, E12/E47, and β-tubulin (β-tub; control) was determined by RT-PCR in undifferentiated MESC ES cells (day 0) and in cells differentiated for 3, 6, 9, and 12 d. (b) MESC20 ES cells were differentiated for 6 d and assessed for Snail (i), Slug (ii), and E12/E47 (iii) proteins using immunofluorescent microscopy. DAPI shows the total cells within the field of view. Bar, 5 μm. (c) Transcript expression of matrixmetalloproteinase (MMP)-2 and -9, tissue inhibitor of metalloproteinase (TIMP)-1 and -2 and β-tubulin (β-tub; control) was determined by RT-PCR in undifferentiated and differentiating ES cells. (d) Gelatin zymogram analysis was performed to determine MMP-2 and -9 activity within the culture supernatants of undifferentiated and differentiating MESC20 ES cells. Media control (lane 1); undifferentiated MESC20 ES cells (lane 2); and MESC20 ES cells differentiated for 3 d (lane 3), 5 d (lane 4), and 9 d (lane 5). Arrow shows the size of active MMP-2 (65 kDa). Note that MMP-9 was not detected under these conditions. (e) Cellular motility of undifferentiated and differentiating (3 d in the absence of LIF) wild-type ES cells was assessed using Costar Transwell 5-μm pore size plates. Data represents the fold change in motility compared with undifferentiated cells. Note that cells cultured in the absence of LIF exhibit increased motility compared with undifferentiated cells. Similar results were obtained with D3 and MESC20 ES cells.
Figure 3.
Figure 3.
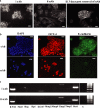
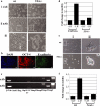
Loss of E-cadherin–mediated cell–cell contact in ES cells induces reversible actin cytoskeleton rearrangement in the absence of up-regulation of EMT-associated transcripts. (a) D3 ES cells cultured in ES cell medium containing FCS+LIF on gelatin-treated plates were treated with either (i) control antibody (cAb) or (ii) E-cadherin–neutralizing antibody (nAb) DECMA-1 for 24 h and actin cytoskeleton arrangement determined using Texas Red–conjugated phalloidin and fluorescent microscopy analysis. (iii) DECMA-1 antibody was removed from the treated cells, and actin cytoskeleton arrangement assessed after 3 d as described above. Bar, 10 μm. (b) D3 ES cells cultured for six passages (∼12 d) in FCS+LIF and either control antibody (cAb) or neutralizing antibody DECMA-1 (nAb) were assessed for DAPI, OCT-4 and E-cadherin protein expression by immunofluorescent microscopy. Bar, 10 μm. (c) Analysis of EMT-associated transcripts was determined by RT-PCR in D3 ES cells treated with either (i) control (cAb) or (ii) DECMA-1 (nAb) antibody for 72 h (C, control; β-tub, β-tubulin). Similar results were also obtained with MESC20 ES cells.
Figure 4.
Figure 4.
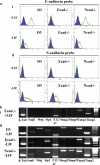
E- and N-cadherin proteins are independently regulated after ES cell differentiation and neither protein is required for up-regulation of EMT-associated transcripts. (a) (i) D3, E-cadherin null (Ecad−/−) and N-cadherin null (Ncad−/−) ES cells were assessed for expression of cell surface E-cadherin protein in the presence of LIF (+LIF) and in the absence of LIF for 3 d (−LIF) in gelatin-treated plates using fluorescent flow cytometry analysis. E-cadherin (open population); isotype control (closed population). (ii) D3, Ecad−/− and Ncad−/− ES cells were assessed for expression of cell surface N-cadherin protein in the presence of LIF (+LIF) and in the absence of LIF for 3 d (−LIF) as described above. N-cadherin (open population); isotype control (closed population). (b) RT-PCR analysis of EMT-associated transcript expression in (i) undifferentiated ES cells (E-cad−/− only shown) and (ii) D3, Ecad−/− and N-cad−/− ES cells differentiated for 3 d in the absence of LIF in gelatin-treated plates.
Figure 5.
Figure 5.
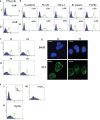
5T4 antigen is localized at the plasma membrane in E-cadherin null ES cells. (a) D3, E-cadherin null (Ecad−/−) and N-cadherin null (Ncad−/−) ES cells were assessed for expression of cell surface 5T4 antigen in the presence of LIF (+LIF) and in the absence of LIF for 3 d (−LIF) in gelatin-treated plates using fluorescent flow cytometry analysis. 5T4 antigen (open population); isotype control (closed population). (b) (i) Immunofluorescence microscopy analysis of 5T4 antigen expression in E-cadherin null ES cells (DAPI shows total nuclei in the field of view). Bar, 10 μm. (ii) Enlarged image of the cells marked in b, pane i, demonstrating polarized expression of 5T4 in E-cadherin null ES cells. (c) Undifferentiated Ecad−/− ES cells were transfected with 2 μg of either (i) control (pCMV-neo) vector or (ii) vector containing full-length E-cadherin cDNA (pCMV-Ecad) using the Amaxa electroporation system and assessed for cellular phenotype by phase-contrast microscopy. (d) Cells transfected with (i) pCMV-neo vector or (ii) pCMV-Ecad were assessed for expression of cell surface E-cadherin (E-cad probe) and 5T4 antigen (5T4 probe) using fluorescent flow cytometry as described above. (e) Immunofluorescence microscopy analysis of 5T4 antigen expression in E-cadherin null ES cells transfected with pCMV-Ecad vector (DAPI shows total nuclei in the field of view). Bar, 5 μm.
Figure 6.
Figure 6.
Loss of E-cadherin–mediated cell–cell contacts in wild-type ES cells results in transcriptional- and translational-independent localization of the 5T4 antigen at the cell surface. Undifferentiated D3 or MESC20 ES cells were cultured on gelatin-treated plates in FCS+LIF. (a) D3 ES cells were cultured in the presence of (i) control antibody (cAb) or (ii) E-cadherin–neutralizing antibody DECMA-1 (nAb) and 5T4 antigen expression assessed by fluorescent flow cytometry analysis. 5T4 antigen (open population); isotype control (closed population). (b) Undifferentiated D3 cells were cultured in FCS+LIF and the presence of (i) cAb or (ii) nAb and assessed for expression of the cell surface proteins N-cadherin, NCAM, SSEA-1, β1-integrin, and FGFR1. Note that no significant differences were observed for these antigens in the two antibody treatments. Similar results were obtained with MESC20 ES cells and E-cadherin null ES cells (data not shown). (c) (i) Undifferentiated MESC20 ES cells were cultured in the presence of cAb (filled population) or nAb (open population) for 3 and 6 h, and cell surface 5T4 antigen was assessed by fluorescent flow cytometry. (ii) Cell surface 5T4 antigen expression was determined in MESC20 ES cells after removal of cAb or nAb from the cells for 3 and 6 h using fluorescent flow cytometry. (d) Undifferentiated MESC20 ES cells were cultured in the presence of nAb for 1 and 3 h and 5T4 antigen (5T4) assessed by fluorescent microscopy. DAPI shows all cell nuclei within the field of view. Bar, 5 μm. (e) (i) ES cells expressing GFP under control of the 5T4 promoter were cultured in the presence of cAb (closed population) or nAb (open population) for 3 h, and GFP expression was assessed using fluorescent flow cytometry. Inset shows GFP expression in these cells after removal of LIF for 3 d. (ii) MESC20 ES cells were cultured in the presence of cAb (closed population) or nAb (open population) and 10 μg/ml cyclohexamide to inhibit total protein synthesis, and cell surface 5T4 antigen was assessed using fluorescent flow cytometry after 3 h. (iii) MESC20 ES cells were cultured in the presence of cAb (closed population) or nAb (open population) and 10 μM sodium azide to inhibit energy (ATP)-dependent processes and cell surface 5T4 antigen assessed using fluorescent flow cytometry after 3 h. Similar results were also obtained with D3 ES cells (data not shown).
Figure 7.
Figure 7.
5T4 null ES cells exhibit EMT-associated events after differentiation. 5T4 null ES cells were isolated as described in Materials and Methods. (a) (i) Genotyping of 5T4 null ES cells (clones 1 and 2) compared with wild-type E14 and D3 ES cells was assessed by PCR. Wild-type ES cells exhibited a 600-bp product, whereas 5T4−/− ES cells exhibited an 800-bp product. (ii) Phase-contrast microscopy image of undifferentiated 5T4−/− ES cells cultured in ES cell medium (FCS+LIF). (iii) SSEA-1 expression was determined in undifferentiated 5T4−/− ES cells by fluorescent flow cytometry analysis. (iv) Expression of NANOG protein in undifferentiated 5T4−/− ES cells was assessed using fluorescent microscopy. Bar, 5 μm. (b) Cell surface E-cadherin (E-cad) and N-cadherin (N-cad) proteins were assessed in undifferentiated 5T4−/− ES cells (day 0) and differentiated cells for 3, 6, 9, and 12 d by fluorescent flow cytometry in a Becton-Dickinson FACScaliber. E- or N-cadherin, open population; isotype control antibodies, closed population. (c) Fluorescent flow cytometry dual staining for E- and N-cadherin on 5T4−/− ES cells differentiated for 3 d as described above. (d) RT-PCR analysis of E- (E-cad) and N-cadherin (N-cad) and β-tubulin (β-tub; control) transcript expression was assessed in undifferentiated 5T4−/− ES cells (day 0) and in cells differentiated for 3, 6, 9, and 12 d as described above. (e) 5T4−/− ES cells were differentiated for 3 d as described above, and E-cadherin–positive (+ve) and E-cadherin–negative (−ve) cells were isolated by FACS. RT-PCR was performed on the samples to assess E- (E-cad) and N-cadherin (N-cad) and β-tubulin (β-tub) transcript expression. (f) Transcript expression of Snail, Slug, and E12/E47 was determined by RT-PCR in undifferentiated 5T4−/− ES cells (day 0) and in cells differentiated for 3, 6, 9, and 12 d. (g) 5T4−/− ES cells were differentiated for 6 d and assessed for Snail (i), Slug and (ii), E12/E47 (iii) proteins using immunofluorescent microscopy. DAPI shows the total cells within the field of view. Bar, 5 μm. (h) Transcript expression of matrixmetalloproteinase (MMP)-2 and -9 and tissue inhibitor of metalloproteinase (TIMP)-1 and -2 was determined by RT-PCR in undifferentiated and differentiating 5T4−/− ES cells as described above. (j) Gelatin zymogram analysis was performed to determine MMP-2 and -9 activity within the culture supernatants of undifferentiated (day 0) and 5T4−/− ES cells differentiated for 6 d (day 6). Arrow shows the size of active MMP-2 (65 kDa). Note that MMP-9 was not detected under these conditions.
Figure 8.
Figure 8.
5T4−/− ES cells exhibit altered phenotype after treatment with DECMA-1 antibody and decreased motility after differentiation. (a) E14 and 5T4−/− ES cells were cultured on gelatin-treated plates in the presence of LIF and an excess (23.2 μg/ml IgG component) of either (i) control antibody (cAb) or (ii) E-cadherin neutralizing antibody DECMA-1 (nAb) and colony phenotype assessed after 24 h using phase contrast microscopy. (iii) Enlarged image of the marked areas in panel ii. Note that the cellular phenotype of 5T4−/− ES cells is altered compared with wild-type ES cells. (b) 5T4−/− ES cells cultured for 24 h in FCS+LIF and neutralizing antibody DECMA-1 (nAb) and assessed for DAPI, OCT-4, and E-cadherin protein expression by immunofluorescent microscopy. Bar, 5 μm. (c) Analysis of EMT-associated transcripts was determined by RT-PCR in 5T4−/− ES cells treated with either (i) control (cAb) or (ii) DECMA-1 (nAb) antibody for 72 h (C, control; β-tub, β-tubulin). (d) Cellular motility of undifferentiated and differentiating (3 d in the absence of LIF) wild-type and 5T4−/− ES cells was assessed using Costar Transwell 5-μm pore size plates. Data represents the fold change in motility compared with undifferentiated cells. Note that 5T4−/− cells cultured in the absence of LIF exhibit decreased motility compared with control cells. (e) (i) Phase-contrast microscopy images showing wild-type (wt) and 5T4−/− ES cell colony morphology 24 h after induction of differentiation. (ii) Enlarged images of the marked areas shown in panel i. (f) Cellular motility of undifferentiated and differentiating (3 d in the absence of LIF) wild-type (D3) and N-cadherin−/− ES cells was assessed using Costar Transwell 5-μm pore size plates. Data represents the fold change in motility compared with undifferentiated cells. Note that Ncad−/− cells cultured in the absence of LIF exhibit decreased motility compared with control cells.

Similar articles

Cited by

References

    1. Barrallo-Gimeno A., Nieto M. A. The Snail genes as inducers of cell movement and survival: implications in development and cancer. Development. 2005;132:3151–3161. - PubMed
    1. Barrow K. M., Perez-Campo F., Ward C. M. Use of the cytomegalovirus promoter for transient and stable transgene expression in mouse embryonic stem cells. Methods Mol. Biol. 2006;329:283–294. - PubMed
    1. Barrow K. M., Ward C. M., Rutter J., Ali S., Stern P. L. Embryonic expression of murine 5T4 oncofoetal antigen is associated with morphogenetic events at implantation and in developing epithelia. Dev. Dynam. 2005;233:1535–1545. - PubMed
    1. Bates R. C., Mercurio A. M. The epithelial-mesenchymal transition (EMT) and colorectal cancer progression. Cancer Biol. Ther. 2005;4:365–370. - PubMed
    1. Behr R., Heneweer C., Viebahn C., Denker H. W., Thie M. Epithelial-mesenchymal transition in colonies of rhesus monkey embryonic stem cells: a model for processes involved in gastrulation. Stem Cells. 2005;23:805–816. - PubMed

Publication types

MeSH terms