. 2007 Jul;176(3):1893-905.
doi: 10.1534/genetics.107.072637. Epub 2007 May 16.

A validated whole-genome association study of efficient food conversion in cattle

Affiliations

A validated whole-genome association study of efficient food conversion in cattle

W Barendse et al. Genetics. 2007 Jul.

Abstract

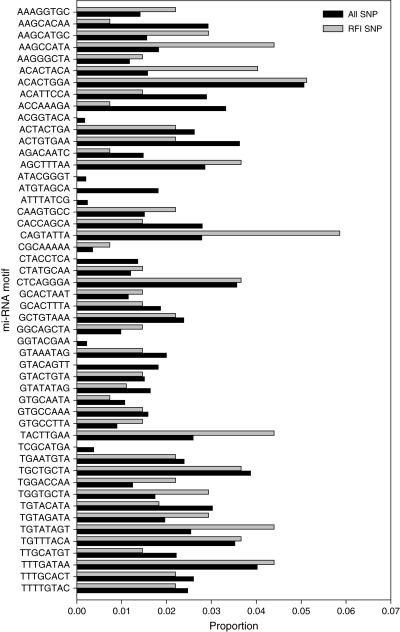
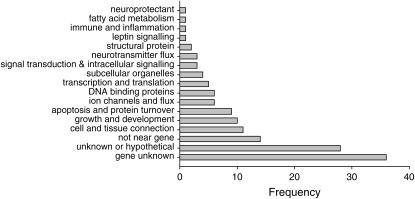
The genetic factors that contribute to efficient food conversion are largely unknown. Several physiological systems are likely to be important, including basal metabolic rate, the generation of ATP, the regulation of growth and development, and the homeostatic control of body mass. Using whole-genome association, we found that DNA variants in or near proteins contributing to the background use of energy of the cell were 10 times as common as those affecting appetite and body-mass homeostasis. In addition, there was a genic contribution from the extracellular matrix and tissue structure, suggesting a trade-off between efficiency and tissue construction. Nevertheless, the largest group consisted of those involved in gene regulation or control of the phenotype. We found that the distribution of micro-RNA motifs was significantly different for the genetic variants associated with residual feed intake than for the genetic variants in total, although the distribution of promoter sequence motifs was not different. This suggests that certain subsets of micro-RNA are more important for the regulation of this trait. Successful validation depended on the sign of the allelic association in different populations rather than on the strength of the initial association or its size of effect.


Figures

F<sc>igure</sc> 1.—
Figure 1.—
(A) Histogram of allele frequencies in the whole genome association study. (B) The relationship between t-test and allele frequency in the whole genome association study, showing a density threshold at ∼t = 2.5. (C) The relationship between t-test and the average effect of allele substitution in the whole genome association study, showing large α-values for t > 2.5.
F<sc>igure</sc> 2.—
Figure 2.—
(A) The reduction in significance of adjacent loci compared to the distance between adjacent loci as an estimator of the effective detection distance from the QTL. At least one member of each pair of SNP had P < 0.01. The most significant SNP from each region was compared to SNPs on both sides, although this was not always possible, and a maximum of three SNPs from each genetic region was used. (B) The LD (r2) between the pairs of SNPs in a, plotted against distance between adjacent loci. (C) The reduction in significance between adjacent loci plotted against LD (r2) for the loci in A.
F<sc>igure</sc> 3.—
Figure 3.—
(A) A comparison of the t-test value of significant SNPs of the WGA with their tests in the validation experiment. Those that were significant in only some of the breeds but not in the combined validation sample are noted. Ten of the SNPs in the validation experiment were not significant in the WGA and were included as a control. This shows that, above the significance threshold, there is no relationship between the significance of a SNP in the WGA and its significance in the validation experiment. (B) Allele substitution in the WGA compared to allele substitution in the validation sample. This shows that failure in validation is not based on the size of the allele effect in the WGA. (C) Allele substitution in different breeds plotted against the combined estimate of the allele substitution for SNPs significant overall in the validation experiment. The graph shows the α-values for all the breeds for a particular SNP in the same column, and the location of the column on the x-axis indicates the magnitude of the combined α-value. This shows that there are large differences between allele effects in different breeds.
F<sc>igure</sc> 4.—
Figure 4.—
The distribution of mi-RNA motifs in the SNP sequences associated with RFI compared to the motifs in all the SNPs in the WGA panel.
F<sc>igure</sc> 5.—
Figure 5.—
The frequency of genes of different classes in the WGA experiment.

Similar articles

Cited by

References

    1. Barendse, W. J., 2002. DNA markers for meat tenderness. Patent application WO02064820.
    1. Barendse, W., 2005. The transition from quantitative trait loci to diagnostic test in cattle and other livestock. Aust. J. Exp. Agric. 45: 831–836.
    1. Barendse, W., R. J. Bunch, B. E. Harrison and M. B. Thomas, 2006. The growth hormone 1 GH1:c.457C>G mutation is associated with relative fat distribution in intra-muscular and rump fat in a large sample of Australian feedlot cattle. Anim. Genet. 37: 211–214. - PubMed
    1. Barendse, W., R. J. Bunch, J. W. Kijas and M. B. Thomas, 2007. The effect of genetic variation of the retinoic acid receptor-related orphan receptor C gene on fatness in cattle. Genetics 175: 843–853. - PMC - PubMed
    1. Bejerano, G., M. Pheasant, I. Makunin, S. Stephen, W. J. Kent et al., 2004. Ultraconserved elements in the human genome. Science 304: 1321–1325. - PubMed