

Bayesian mapping of genomewide interacting quantitative trait loci for ordinal traits
- PMID: 17507680
- PMCID: PMC1931535
- DOI: 10.1534/genetics.107.071142
Bayesian mapping of genomewide interacting quantitative trait loci for ordinal traits
Abstract
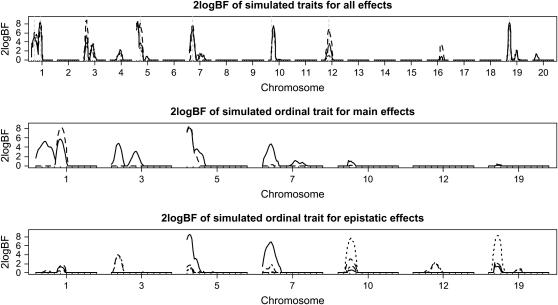
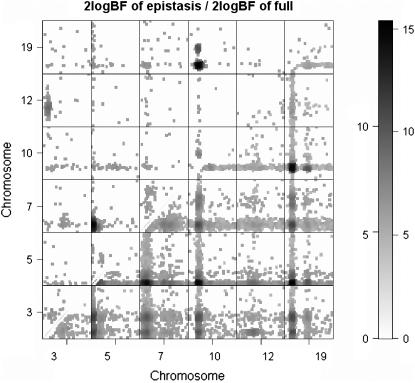
Development of statistical methods and software for mapping interacting QTL has been the focus of much recent research. We previously developed a Bayesian model selection framework, based on the composite model space approach, for mapping multiple epistatic QTL affecting continuous traits. In this study we extend the composite model space approach to complex ordinal traits in experimental crosses. We jointly model main and epistatic effects of QTL and environmental factors on the basis of the ordinal probit model (also called threshold model) that assumes a latent continuous trait underlies the generation of the ordinal phenotypes through a set of unknown thresholds. A data augmentation approach is developed to jointly generate the latent data and the thresholds. The proposed ordinal probit model, combined with the composite model space framework for continuous traits, offers a convenient way for genomewide interacting QTL analysis of ordinal traits. We illustrate the proposed method by detecting new QTL and epistatic effects for an ordinal trait, dead fetuses, in a F(2) intercross of mice. Utility and flexibility of the method are also demonstrated using a simulated data set. Our method has been implemented in the freely available package R/qtlbim, which greatly facilitates the general usage of the Bayesian methodology for genomewide interacting QTL analysis for continuous, binary, and ordinal traits in experimental crosses.
Figures
Similar articles
-
Mapping multiple quantitative trait Loci for ordinal traits.Behav Genet. 2004 Jan;34(1):3-15. doi: 10.1023/B:BEGE.0000009473.43185.43. Behav Genet. 2004. PMID: 14739693
-
R/qtlbim: QTL with Bayesian Interval Mapping in experimental crosses.Bioinformatics. 2007 Mar 1;23(5):641-3. doi: 10.1093/bioinformatics/btm011. Epub 2007 Jan 19. Bioinformatics. 2007. PMID: 17237038 Free PMC article.
-
An efficient Bayesian model selection approach for interacting quantitative trait loci models with many effects.Genetics. 2007 Jul;176(3):1865-77. doi: 10.1534/genetics.107.071365. Epub 2007 May 4. Genetics. 2007. PMID: 17483424 Free PMC article.
-
Advances in Bayesian multiple quantitative trait loci mapping in experimental crosses.Heredity (Edinb). 2008 Mar;100(3):240-52. doi: 10.1038/sj.hdy.6801074. Epub 2007 Nov 7. Heredity (Edinb). 2008. PMID: 17987056 Free PMC article. Review.
-
[Advances in researches on application of Bayesian methods to QTL mapping].Yi Chuan. 2007 Jun;29(6):668-74. doi: 10.1360/yc-007-0668. Yi Chuan. 2007. PMID: 17650482 Review. Chinese.
Cited by
-
A Segregating Inversion Generates Fitness Variation in Yellow Monkeyflower (Mimulus guttatus).Genetics. 2016 Apr;202(4):1473-84. doi: 10.1534/genetics.115.183566. Epub 2016 Feb 11. Genetics. 2016. PMID: 26868767 Free PMC article.
-
Statistical analysis of genetic interactions.Genet Res (Camb). 2010 Dec;92(5-6):443-59. doi: 10.1017/S0016672310000595. Genet Res (Camb). 2010. PMID: 21429274 Free PMC article. Review.
-
Variable selection for large p small n regression models with incomplete data: mapping QTL with epistases.BMC Bioinformatics. 2008 May 29;9:251. doi: 10.1186/1471-2105-9-251. BMC Bioinformatics. 2008. PMID: 18510743 Free PMC article.
-
Bayesian multilocus association mapping on ordinal and censored traits and its application to the analysis of genetic variation among Oryza sativa L. germplasms.Theor Appl Genet. 2009 Mar;118(5):865-80. doi: 10.1007/s00122-008-0945-6. Epub 2009 Jan 9. Theor Appl Genet. 2009. PMID: 19132337
-
Bayesian robust analysis for genetic architecture of quantitative traits.Bioinformatics. 2009 Apr 15;25(8):1033-9. doi: 10.1093/bioinformatics/btn558. Epub 2008 Oct 30. Bioinformatics. 2009. PMID: 18974168 Free PMC article.
References
-
- Albert, J. H., and S. Chib, 1993. Bayesian analysis of binary and polychotomous response data. J. Am. Stat. Assoc. 88: 669–679.
-
- Broman, K. W., H. Wu, Ś. Sen and G. A. Churchill, 2003. R/qtl: QTL mapping in experimental crosses. Bioinformatics 19: 889–890. - PubMed
Publication types
MeSH terms
Grants and funding
LinkOut - more resources
Full Text Sources
Molecular Biology Databases
Miscellaneous
