Comparative Study
. 2007 Jul;176(3):1511-26.
doi: 10.1534/genetics.106.070177. Epub 2007 May 16.

Contrasting effects of in vitro fertilization and nuclear transfer on the expression of mtDNA replication factors

Affiliations
Comparative Study

Contrasting effects of in vitro fertilization and nuclear transfer on the expression of mtDNA replication factors

Emma J Bowles et al. Genetics. 2007 Jul.

Abstract

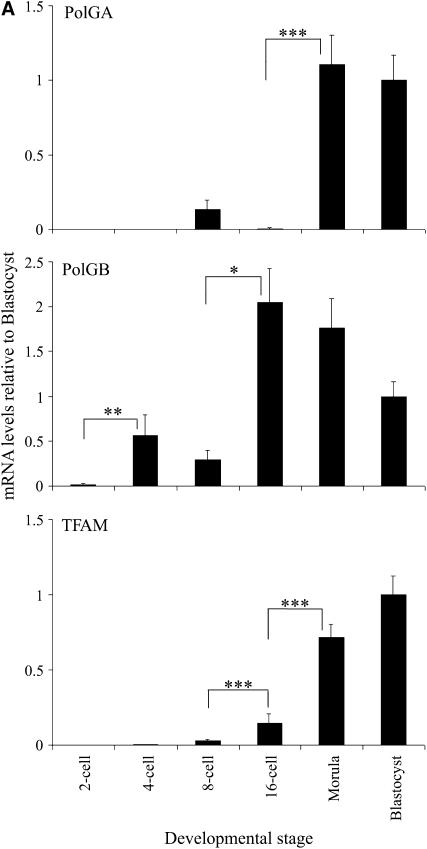
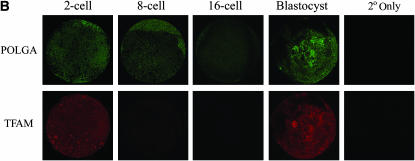
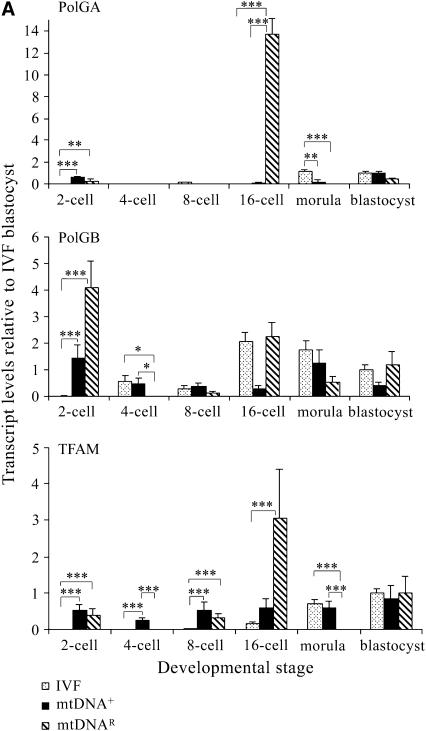
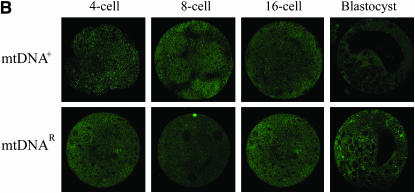
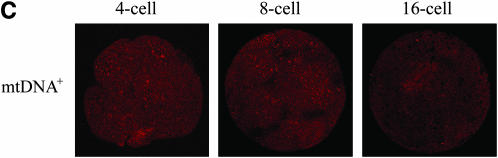
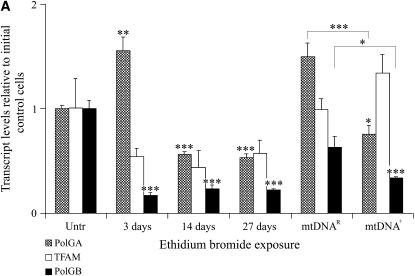
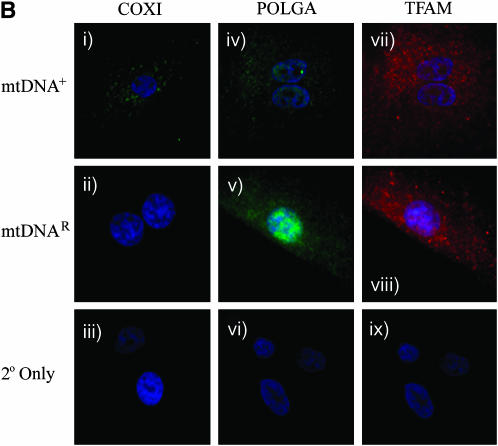
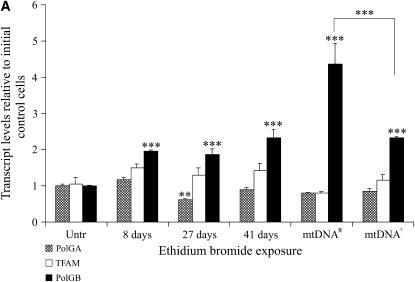
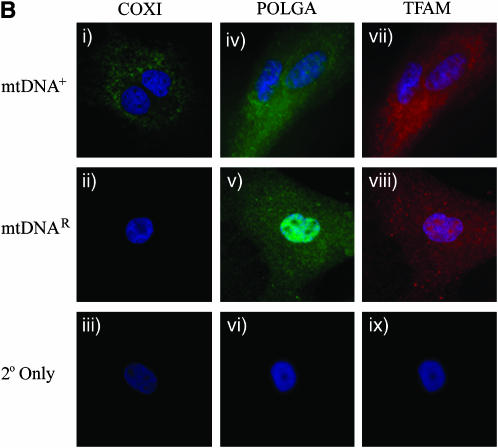
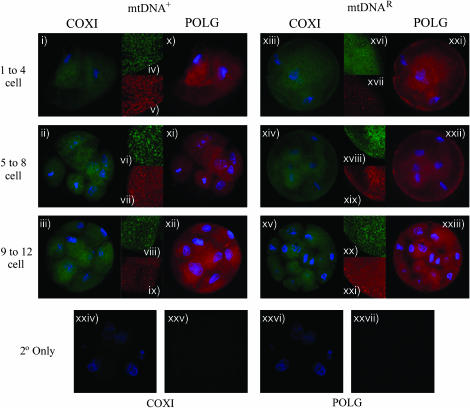
Mitochondrial DNA (mtDNA) is normally only inherited through the oocyte. However, nuclear transfer (NT), the fusion of a donor cell with an enucleated oocyte, can transmit both donor cell and recipient oocyte mtDNA. mtDNA replication is under the control of nuclear-encoded replication factors, such as polymerase gamma (POLG) and mitochondrial transcription factor A (TFAM). These are first expressed during late preimplantation embryo development. To account for the persistence of donor cell mtDNA, even when introduced at residual levels (mtDNA(R)), we hypothesized that POLG and TFAM would be upregulated in intra- and interspecific (ovine-ovine) and intergeneric (caprine-ovine) NT embryos when compared to in vitro fertilized (IVF) embryos. For the intra- and interspecific crosses, PolGA (catalytic subunit), PolGB (accessory subunit), and TFAM mRNA were expressed at the 2-cell stage in both nondepleted (mtDNA(+)) and mtDNA(R) embryos with protein being expressed up to the 16-cell stage for POLGA and TFAM. However, at the 16-cell stage, there was significantly more PolGA expression in the mtDNA(R) embryos compared to their mtDNA(+) counterparts. Expression for all three genes first matched IVF embryos at the blastocyst stage. In the intergeneric model, POLG was upregulated during preimplantation development. Although these embryos did not persist further than the 16+-cell stage, significantly more mtDNA(R) embryos reached this stage. However, the vast majority of these embryos were homoplasmic for recipient oocyte mtDNA. The upreglation in mtDNA replication factors was most likely due to the donor cells still expressing these factors prior to NT.


Figures

F<sc>igure</sc> 1.—
Figure 1.—
Expression of mtDNA replication factors in IVF-generated preimplantation embryos. (A) mRNA levels for PolGA, PolGB, and TFAM. For each stage of embryo development, embryos were analyzed in pools of five, where absolute mRNA levels were determined by real-time RT–PCR and then expressed relative to levels present in IVF blastocysts (mean ± SEM). Overall variation and differences between consecutive stages were analyzed for significance using a one-way ANOVA test with Bonferroni post hoc tests for each gene. Significance between individual stages of development for each gene is indicated by a bar denoted by *P < 0.05, **P < 0.01, and ***P < 0.001. (B) ICC analysis of POLGA (FITC; green; top), and TFAM (rhodamine; red; bottom) expression in 2-, 8-, and 16-cell and blastocyst stage IVF-generated embryos. Individual whole embryos were imaged with a Leica DM IRE2 confocal microscope (×63 objective and ×3 digital zoom) using identical gain and photo multiplier settings (see materials and methods). POLGA was labeled with the Alexa Fluor 488 anti-rabbit IgG secondary antibody (Molecular Probes) and excited at 488 nm and detected between 500 and 535 nm. TFAM was labeled using the Alexa Fluor 594 anti-goat secondary antibody and was excited at 594 nm and detected between 600 and 700 nm. Controls using only the secondary antibodies (2° only) showed no staining.
F<sc>igure</sc> 2.—
Figure 2.—
Expression of mtDNA replication factors in NT-generated preimplantation embryos. (A) mRNA levels for PolGA, PolGB, and TFAM in IVF- and NT-generated embryos. NT embryos were derived using mtDNA+ and mtDNAR donor cells. Embryos were analyzed in pools of five. mRNA levels were quantified using real-time RT–PCR and relative levels expressed as a ratio of those for IVF blastocysts (value = 1). Overall significance and significance between embryo groups at each developmental stage for each gene were determined using a two-way ANOVA test. Bonferroni post tests were then performed to determine the significance of differences between individual stages of development for each gene where *P < 0.05, **P < 0.01, and ***P < 0.001. (B) ICC analysis of 4-, 8-, and 16-cell and blastocyst stage mtDNA+ and mtDNAR preimplantation embryos for protein expression of POLGA (FITC; green). POLGA was detected with the Alexa Fluor 488 anti-rabbit IgG secondary antibody (Molecular Probes) and individual embryos were imaged using a Leica DM IRE2 confocal microscope (×63 objective and ×3 digital zoom). FITC was excited at 488 nm and emitted between 500 and 535 nm. (C) ICC analysis of TFAM (rhodamine; red) protein levels in 4-, 8-, and 16-cell stage mtDNA+ preimplantation embryos. TFAM was detected with the Alexa Fluor 594 anti-goat secondary antibody and was excited at 594 nm and emitted between 600 and 700 nm. Identical gain and photo multiplier settings were applied as described in materials and methods.
F<sc>igure</sc> 3.—
Figure 3.—
Logistic regression analysis of the relationship between evolutionary distance and development to the blastocyst stage. The evolutionary distance from the donor cell and each embryo was determined following ClustalW alignment of mtDNA sequences and pairwise analysis of sequence variations using DNADIST (see materials and methods). The embryos were divided into those that had developed to blastocyst and those that arrested prior to blastocyst (non-blastocyst). Their respective evolutionary distances were plotted and analyzed using the statistical package R. Individual embryos are represented by circles (mtDNA+) and triangles (mtDNAR).
F<sc>igure</sc> 4.—
Figure 4.—
Expression of mtDNA replication factors in SFF1 (ovine) cells cultured with and without EtBr, as determined by real-time RT–PCR and ICC. (A) mRNA expression for TFAM, PolGA, and PolGB over the period of depletion was determined by real-time RT–PCR and normalized to β-actin. They were then expressed as a ratio of the initial untreated sample (Untr), which was assigned a value of 1. Mean values ± SEM are shown. Overall variation and differences between cells over time (Untr, 3, 14, and 27 days, and mtDNAR and mtDNA+) for each gene were analyzed for significance using a one-way ANOVA test. Individual post hoc tests between each stage of depletion and Untr were determined following adjustment with Bonferroni and significance was indicated above the respective stage of depletion and denoted by *P < 0.05, **P < 0.01, ***P < 0.001. The difference between the final treated (mtDNAR) and untreated (mtDNA+) samples was tested for significance in the same manner. (B) Detection of the mtDNA-encoded COXI protein by a FITC 488-conjugated secondary antibody (green; i–iii), excited at 488 nm, and detected at 515–565 nm; POLGA by a FITC 488-conjugated secondary (green; iv–vi), excited at 488 nm, and detected at 515–565 nm; and TFAM by rhodamine 594-conjugated secondary (Red; vii-ix), excited at 450 nm, and detected at 580–590 nm. Images were acquired by fluorescence microscopy (×100 objective) using an Axioplan 2 imaging system, HBO100 (Zeiss). Controls using only the secondary antibodies (2° only, iii, vi, and ix) showed no staining.
F<sc>igure</sc> 5.—
Figure 5.—
Expression of mtDNA replication factors in SFF2 (caprine) cells cultured with and without EtBr. (A) mRNA levels for TFAM, PolGA, and PolGB were determined by RT–PCR and real-time PCR throughout the period in culture (Untr, 8, 27, and 41 days, and mtDNAR and mtDNA+) and normalized to β-actin. mRNA levels are presented relative to Untr (value = 1). Bars represent mean ± SEM. Overall variation and differences between individual samples during the period in culture were analyzed for significance using a one-way ANOVA test with Bonferroni post hoc tests for each gene. Individual time points significantly different from Untr were denoted by **P < 0.01 and *** P < 0.001. The difference between the final treated (mtDNAR) and untreated (mtDNA+) samples was also tested by Bonferroni post hoc tests and significance is indicated by adjoining lines. (B) Detection of the mtDNA-encoded COXI protein using a FITC 488-conjugated secondary antibody with excitation at 488 nm and emission at 515–565 nm (green; i–iii). POLGA was detected using a FITC 488-conjugated secondary antibody (green; iv–vi) at 488 nm for excitation and emission at 515–565 nm while TFAM was detected with a rhodamine 594-conjugated secondary antibody with excitation at 450 nm and emission at 580–590 nm (red; vii–ix). Images were acquired at ×100 objective using an Axioplan 2 imaging system, HBO100 (Zeiss). Controls using only the secondary antibodies (2° only; iii, vi, and ix) showed no staining.
F<sc>igure</sc> 6.—
Figure 6.—
The expression of COXI and POLG in preimplantation NT embryos generated using O. aries oocytes and C. hircus donor cells containing either mtDNA+ (i–xii) or mtDNAR (xiii–xxiii) cells. The mtDNA-encoded COXI antibody was detected using a FITC 488-conjugated secondary antibody by excitation at 488 nm and emission at 515–565 nm (i–iii for mtDNA+ embryos and xiii–xv for mtDNAR embryos). POLG was detected using a rhodamine 594-conjugated secondary antibody following excitation at 450 nm and emission at 580–590 nm (x–xii for mtDNA+ embryos and xxi–xxiii for mtDNAR embryos). Embryos were also counterstained with DAPI, which was excited at 395 nm and detected at 420 nm. Whole embryos were imaged at ×100 on an Axioplan 2 imaging system (Zeiss). Additionally, confocal microscopy using a Leica DM IRE2 (×63 objective, ×2 digital zoom) allowed imaging at higher magnification to confirm the presence of the two proteins, COXI (iv, vi, and viii for mtDNA+ embryos; xvi, xviii, and xx for mtDNAR embryos) and POLG (v, vii, and ix for mtDNA+ embryos; xvii, xix, and xxi for mtDNAR embryos). For confocal, FITC (COXI) was excited at 488 nm and detected between 500 and 535 nm, and rhodamine (POLGA) was excited at 594 nm and detected between 600 and 700 nm. Controls using only the secondary antibodies (2° only and DAPI) for COXI (xxiv) and POLG (xxvi) showed no staining under fluorescence microscopy. Additionally, each 2° only was imaged under confocal microscopy (without DAPI staining) for COXI (xxv) and POLG (xxvii).
F<sc>igure</sc> 7.—
Figure 7.—
Determination of homoplasmy/heteroplasmy in caprine–ovine NT embryos by AS–PCR. Fluorescence was acquired in both the FAM (A) and the JOE (B) channels for the donor and recipient oocyte alleles, respectively. Each reaction was considered valid only if the 0.01% allele for donor mtDNA was detected in the FAM channel (A). Each sample was analyzed against a set of standards with known molecular concentrations for each allele and a sample containing 0.01% donor allele (A) and 99.99% recipient allele (B: 0.01% donor). In each of A, B, and C, both donor-specific (gray) and recipient-specific (beige) standards are shown. (C) The sensitivity of the reaction to 0.01% was determined by decreasing amounts of the donor-specific allele in relation to the recipient oocyte allele (100:0, 50:50, 5:95, 1:99, 0.1:99.9, 0.01:99.99, and 0:100%). In each channel, the 100% reaction was equivalent to the highest concentration standard for the respective allele. NTC, no template control.

Similar articles

Cited by

References

    1. Anderson, S., A. T. Bankier, B. G. Barrell, M. H. De Bruijn, A. R. Coulson et al., 1981. Sequence and organization of the human mitochondrial genome. Nature 290: 457–465. - PubMed
    1. Baguisi, A., E. Behboodi, D. T. Melican, J. S. Pollock, M. M. Destrempes et al., 1999. Production of goats by somatic cell nuclear transfer. Nat. Biotechnol. 17: 456–461. - PubMed
    1. Barrientos, A., L. Kenyon and C. T. Moraes, 1998. Human xenomitochondrial cybrids. Cellular models of mitochondrial complex I deficiency. J. Biol. Chem. 273: 14210–14217. - PubMed
    1. Birky, Jr., C. W., 1995. Uniparental inheritance of mitochondrial and chloroplast genes: mechanisms and evolution. Proc. Natl. Acad. Sci. USA 92: 11331–11338. - PMC - PubMed
    1. Bolton, V. N., P. J. Oades and M. H. Johnson, 1984. The relationship between cleavage, DNA replication, and gene expression in the mouse 2-cell embryo. J. Embryol. Exp. Morphol. 79: 139–163. - PubMed

Publication types