. 2007 Jul 2:1156:31-45.
doi: 10.1016/j.brainres.2007.04.043. Epub 2007 Apr 22.

Dopamine receptor mRNA and protein expression in the mouse corpus striatum and cerebral cortex during pre- and postnatal development

Affiliations

Dopamine receptor mRNA and protein expression in the mouse corpus striatum and cerebral cortex during pre- and postnatal development

Kiyomi Y Araki et al. Brain Res. .

Abstract

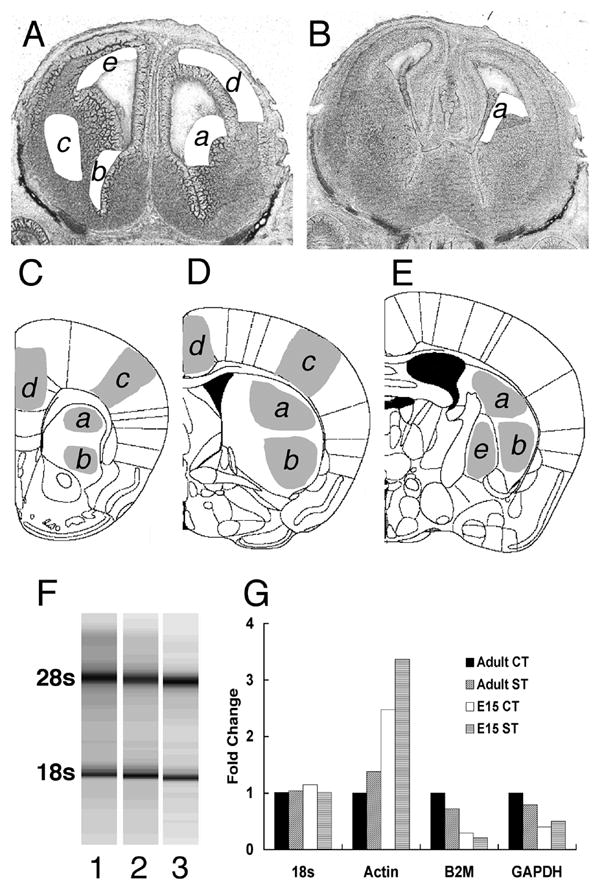
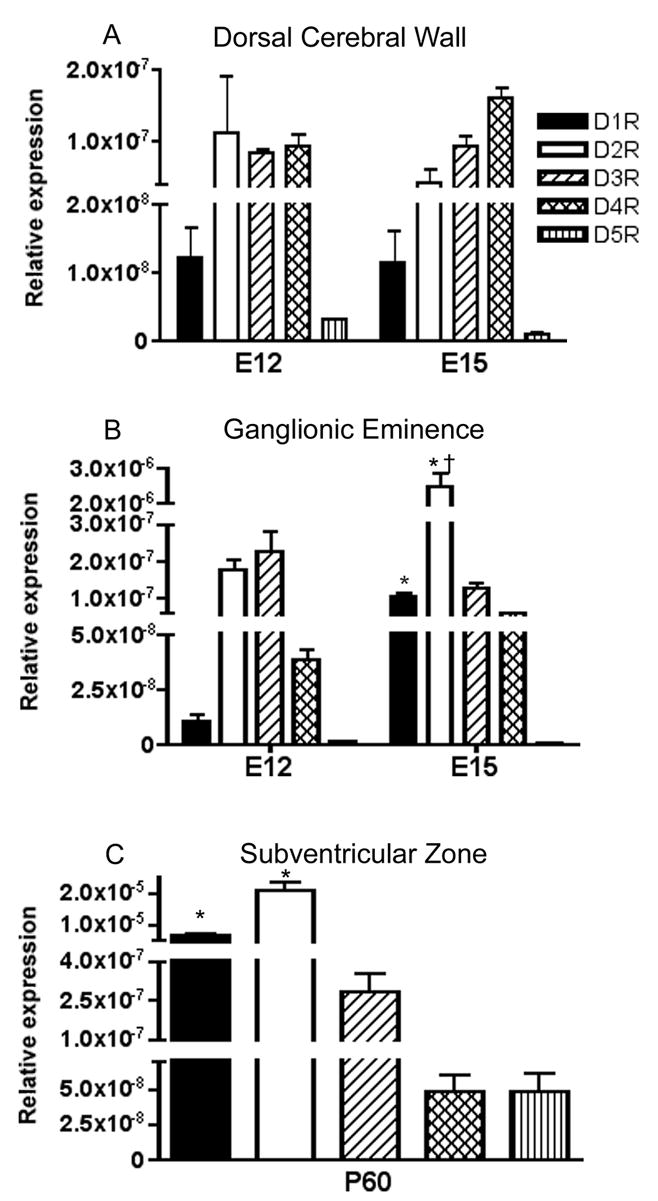
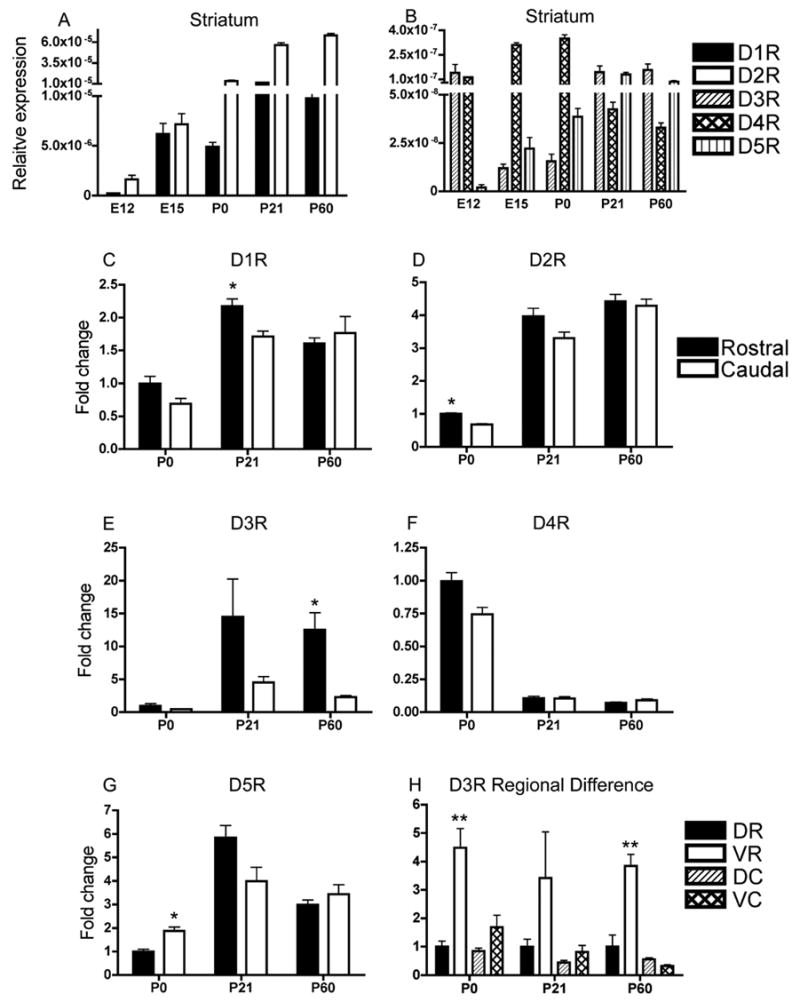
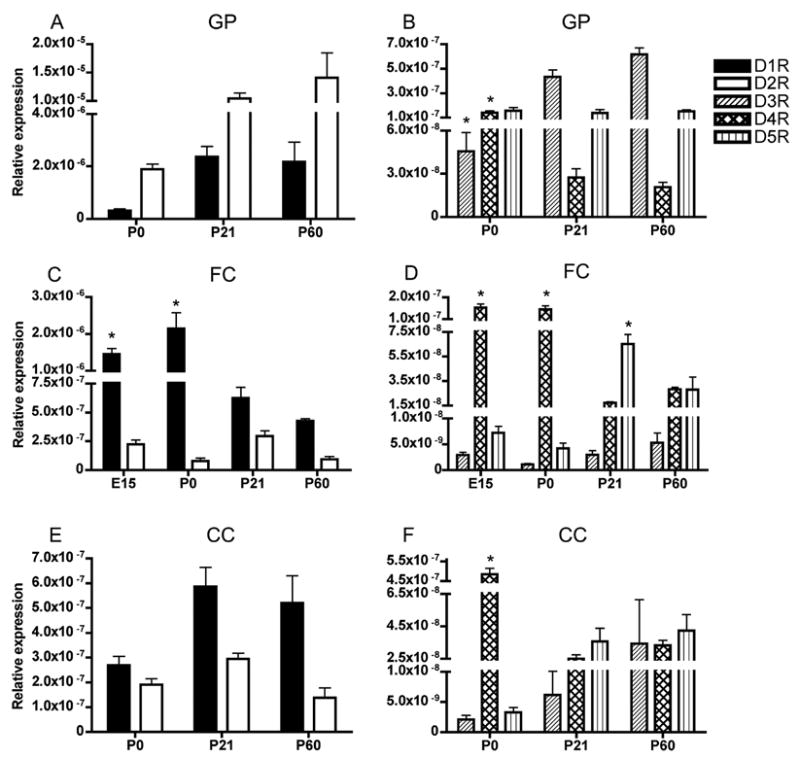
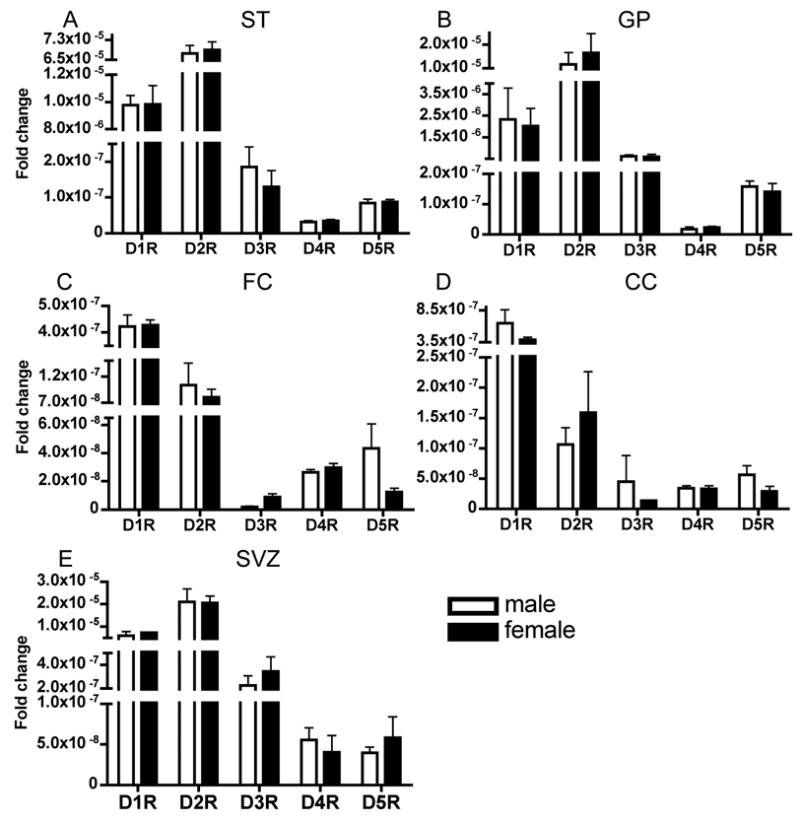
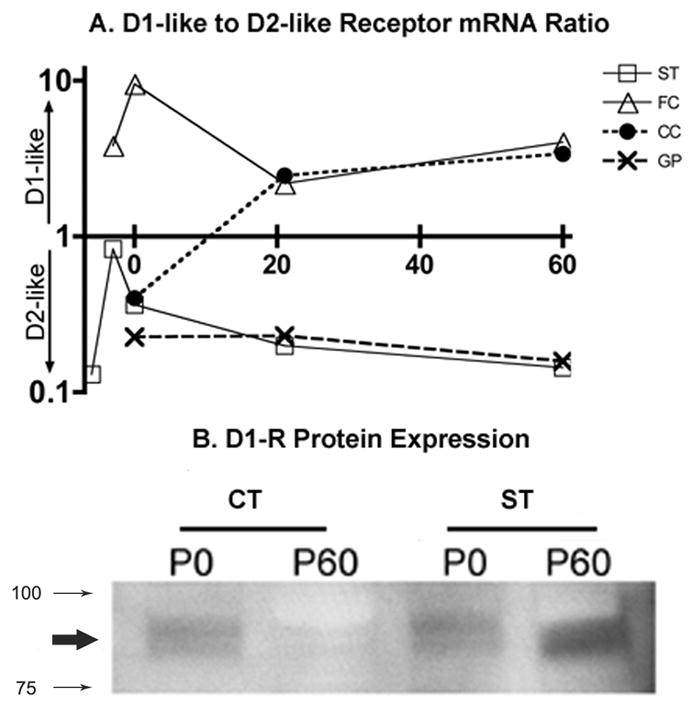
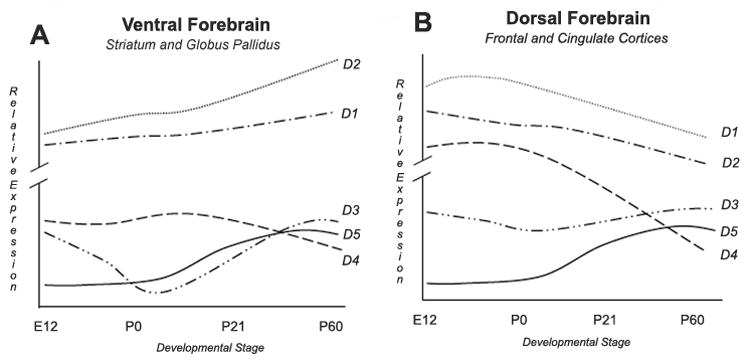
The outcome of dopaminergic signaling and effectiveness of dopaminergic drugs depend on the relative preponderance of each of the five dopamine receptors in a given brain region. The separate contribution of each receptor to overall dopaminergic tone is difficult to establish at a functional level due to lack of receptor subtype specific pharmacological agents. A surrogate for receptor function is receptor protein or mRNA expression. We examined dopamine receptor mRNA expression by quantitative reverse transcription real-time PCR in the striatum, globus pallidus, frontal cortex and cingulate cortex of embryonic and postnatal mice. Samples of each region were collected by laser capture microdissection. D1- and D2-receptor mRNAs were the most abundant in all the regions of the mature brain. The D1-receptor was predominant over the D2-receptor in the frontal and cingulate cortices whereas the situation was reversed in the striatum and globus pallidus. In the proliferative domains of the embryonic forebrain, D3-, D4- and D5-receptors were predominant. In the corpus striatum and cerebral cortex, the D3- and D4-receptors were the only receptors that showed marked developmental regulation. By analyzing D1 receptor protein expression, we show that developmental changes in mRNA expression reliably translate into changes in protein levels, at least for the D1-receptor.


Figures

Figure 1
Figure 1
Collection of tissue samples from sections of the embryonic (A, B) and adult (C, D, E) brains by laser capture microdissection. Two cryostat sections from an E15 brain are shown in A and B after sample collection. A section from rostral levels of the forebrain (A) is shown after samples of the lateral ganglionic eminence (a), medial ganglionic eminence (b) and developing striatum (c) were collected from the ventral forebrain. From the same section, samples of postmitotic (d) and proliferative (e) domains of the cerebral wall were collected from the dorsal forebrain. A section from the caudal forebrain (B) is shown after samples of the caudal ganglionic eminence (a) were collected. Diagrams three representative coronal sections taken from the adult mouse brain atlas [35] are shown in C, D and E. Samples of the striatum were collected from sections intervening between those shown in C and E. Samples taken from sections between C and D represent the rostral striatum and samples taken from sections beginning with D and up E represent the caudal striatum. From each section, samples from the dorsal (a) and ventral (b) striatum were collected separately. In addition to striatal samples, samples of the cingulate cortex (d), frontal sensorimotor cortex (c) and globus pallidus (e) were also collected. Every section between C and E was used from every brain. Qualitative analysis of RNA isolation (F) was performed by nondenaturing capillary gel electrophoresis. A representative gel shows intact 28s (upper bands) and 18s (lower bands) rRNA, without degradation bands or smears (lanes 1, 2, and 3 represent E15 samples from lateral, medial and caudal ganglionic eminences, respectively). (G). Selection of endogenous RNA control for real time reverse transcription quantitative PCR. We used 2μg of total RNA from cerebral cortex (CT) and striatum (ST) each, collected from embryonic day 15 (E15) or adult (P60) mice to assess which generally accepted endogenous control was superior for normalizing expression of mRNA for each region at each age Our results demonstrate that only 18s rRNA levels remained steady between E15 and P60 in the cortex and striatum prompting its choice as the endogenous control in all our experiments. Actin, B2M and GAPDH mRNA levels showed variation between E15 and P60 and between cortex and striatum.
Figure 2
Figure 2
Expression level of dopamine receptor mRNAs in the proliferative neuroepithelium of the dorsal cerebral wall (A) and the ganglionic eminence (B) on E12 and E15 and the subventricular zone on P60 (C). Since there were no statistically significant differences in the expression level of any of the five mRNAs between the lateral, medial and caudal ganglionic eminences at E12 or E15, we combined the data from the 3 subdivisions. (A) Dorsal cerebral wall demonstrates greater D2-like (DR2, DR3 and DR4) than D1-like receptor expression (t(10)=6.363; p<0.0001). (B) * = D1R and D2R are significantly higher at E15 than at E12 (t(18)=6.382 or 5.38, respectively, p<0.0001 for both), † = D2R expression significantly greater than all other dopamine receptors at E15 (p<0.0001 for all post-hoc comparisons). (C) * = D1R and D2R expression lavels are significantly different between each other and compared to all other receptors (F(4,25)=42.8; p<0.0001; Bonferroni p<0.05, for all comparisons) Mean±SEM values from 3–6 individual brains.
Figure 3
Figure 3
Dopamine receptor mRNA expression in the striatum from E12 to P60 (A, B). D1R and D2R mRNA levels are significantly higher than the other mRNAs (Table 2). Therefore, D1R and D2R expression levels are shown separately in A and D3R, D4R and D5R mRNA are shown in B. Since the striatum is a rostro-caudally elongated structure, we analyzed each mRNA separately for rostral and caudal striatum on P0, P21 and P60 (C, D, E, F, G) (C, * = t(13)=3.394; p<0.005 at P21 rostral versus caudal) (D, * = t(10)=7.673; p<0.0001 at P0 rostral vs. caudal) (E, * = t(22)=3.851; p<0.001 at P60 rostral vs. caudal). We also analyzed mRNA expression separately for dorsal and ventral regions of rostral and caudal divisions. Only D3R mRNA showed significant differences among the four sub-regions with the ventral portion of the rostral striatum showing the highest expression at each (H) (** = P0, F(3,8)=16.58; p<0.001, Bonferroni p<0.01 for all ventro-rostral comparisons; P60, F(3,20)=30.52; p<0.0001, Bonferroni p<0.001 for all ventro-rostral comparisons. Mean±SEM values from 3–6 individual brains. DR = dorsal-rostral; VR = ventral-rostral; DC = dorsal-caudal; VC = ventral-caudal.
Figure 4
Figure 4
Developmental profiles of dopamine receptor mRNAs in the globus pallidus (A, B), frontal sensory-motor cortex (C, D) and cingulate cortex (E, F). D1R and D2R mRNA levels are higher than the other mRNAs; therefore, they are shown separately for each region (A, C, E). D3R, D4R and D5R mRNA are also shown for each region (B, D, F). The data from embryonic mice are shown only for the frontal cortex, because in the other regions we could not identify postmitotic differentiating fields consistently in the sections of the embryonic brain during LCM. In the globus pallidus (A, B) D2R mRNA was significantly higher than all the other mRNA at each age (Table 2) and (B) * = D3R mRNA significantly increases from P0 to P60 while * = D4R mRNA significantly decreases from P0 to P60 (Table 1). In frontal cortex (C, D) D1R mRNA was significantly higher than all the other mRNAs at every age (Table 2) and declined during development (C, * = Significantly different from P21 and P60, see Table 1). D4R mRNA decreased during development (D, * = Significantly different from P21 and P60, see Table 1). D5R mRNA was the highest at P21(D, * = see Table 1). In cingulate cortex (E, F) D1R mRNA was significantly higher than all the other mRNAs at all ages except P0 (Table 2). In the cingulate cortex, only D4R mRNA showed significant changes during development (F, * = different from P21 and P60, see Table 1). Mean±SEM values from 3–6 individual brains.
Figure 5
Figure 5
Sex differences in the expression levels of dopamine receptor mRNAs at P60 in the striatum (A), globus pallidus (B), frontal cortex (C), cingulate cortex (D) and the subventricular zone (E). There were no statistically significant differences by t-test between male and female mice in any mRNA in any region. Mean±SEM values from 3–6 individual brains.
Figure 6
Figure 6
An overview of the ratio between D1-like receptors (summation of D1R and D5R) and D2-like receptors (summation of D2R, D3R and D4R) is shown for each region during development (A; age along the abscissa; 0, 21 and 60 = P0, P21 and P60, respectively). Only the striatum at E15 approximates equipoise (ratio 0.8) between the two dopamine receptor classes. The ventral forebrain represented by the striatum (ST) and globus pallidus (GP) show D2-like dominance in receptor expression, whereas the dorsal forebrain represented by frontal (FC) and cingulate (CC) cortex show D1-like dominance. An immunoblot showing D1R protein expression (B). Membrane fractions from postnatal days 0 and 60 (P0 and P60, respectively) cortex and striatum were analyzed for D1R protein expression. The D1R band (bold arrow) appears between ~ 100 and 75 KD (smaller arrows). The highest levels of protein are seen in the adult striatum and the lowest levels in the adult cortex with intermediate levels at P0 in the cortex and striatum.
Figure 7
Figure 7
A summary of the salient differences between ventral (A) and dorsal (B) forebrain with regard to dopamine receptor mRNA expression. For the sake of simplicity, the striatum and globus pallidus are grouped together under ventral forebrain and frontal and cingulate cortices under dorsal forebrain, overlooking differences between each of the 2 regions within a group. Data on prenatal expression are taken from the striatum (E12 and E15) and frontal cortex (E15) only. In both the forebrain regions, D1R and D2R mRNA are by far the most abundant. However, both D1R and D2R mRNA expression is significantly higher in the ventral than dorsal forebrain. D2R mRNA levels are higher than D1R mRNA in the ventral forebrain whereas the opposite is the case in the dorsal forebrain. Whereas both D1R and D2R mRNA increase during development in the ventral forebrain, both show decline in the dorsal forebrain. D3R mRNA shows the most striking developmental change in the ventral forebrain with two peaks separated by a trough anchored around the time of birth. D4R mRNA shows the most striking developmental change in the dorsal forebrain with its high expression level early in development and a rapid decline in the postnatal period. D5R mRNA shows comparable developmental changes in both the regions.

Similar articles

Cited by

References

    1. Altman J, Bayer SA. Atlas of prenatal rat brain development. CRC Press; Boca raton, Fl., USA: 1995.
    1. Bayer SA. Neurogenesis in the rat neostriatum. International Journal of Developmental Neuroscience. 1984;2:163–175. - PubMed
    1. Bergson C, Mrzljak L, Smiley JF, Pappy M, Levenson R, Goldman-Rakic PS. Regional, cellular, and subcellular variations in the distribution of D1 and D5 dopamine receptors in primate brain. J Neurosci. 1995;15:7821–36. - PMC - PubMed
    1. Cepeda C, Levine MS. Dopamine and N-Methyl-D-Aspartate Receptor Interactions in the Neostriatum. Dev Neurosci. 1998;20:1–18. - PubMed
    1. Crandall JE, McCarthy DM, Araki KY, Sims JR, Ren JQ, Bhide PG. Dopamine receptor activation modulates GABA neuron migration from the basal forebrain to the cerebral cortex. J Neurosci. 2007;27:3813–3822. - PMC - PubMed

Publication types

MeSH terms