. 2007 May;26(5):629-41.
doi: 10.1016/j.immuni.2007.03.016.

Elimination of antigen-presenting cells and autoreactive T cells by Fas contributes to prevention of autoimmunity

Affiliations

Elimination of antigen-presenting cells and autoreactive T cells by Fas contributes to prevention of autoimmunity

Peter B Stranges et al. Immunity. 2007 May.

Abstract

Fas (also known as Apo-1 and CD95) receptor has been suggested to control T cell expansion by triggering T cell-autonomous apoptosis. This paradigm is based on the extensive lymphoproliferation and systemic autoimmunity in mice and humans lacking Fas or its ligand. However, with systemic loss of Fas, it is unclear whether T cell-extrinsic mechanisms contribute to autoimmunity. We found that tissue-specific deletion of Fas in mouse antigen-presenting cells (APCs) was sufficient to cause systemic autoimmunity, implying that normally APCs are destroyed during immune responses via a Fas-mediated mechanism. Fas expression by APCs was increased by exposure to microbial stimuli. Analysis of mice with Fas loss restricted to T cells revealed that Fas indeed controls autoimmune T cells, but not T cells responding to strong antigenic stimulation. Thus, Fas-dependent elimination of APCs is a major regulatory mechanism curbing autoimmune responses and acts in concert with Fas-mediated regulation of chronically activated autoimmune T cells.


Figures

Figure 1
Figure 1. Fas expression by DC is regulated by signaling through PRR
A. Some CD11chi cells in regional lymph nodes express Fas directly ex vivo (red line) compared to control CD11chi cells from a Fas knock-out (FasKO) mice (black line). B. All CD11chi cells become Fas+ upon footpad injection (a day before staining) of LPS (red line) or CpG (blue line). Black line – CD11chi cells from a FasKO mouse injected with LPS. C. Fas expression in unstimulated DC is primarily restricted to CD11b+ cells (thick black line) but not to CD8+ DC (thick blue line). Thin lines – same subsets from a FasKO mouse. D. Plasmacytoid DC (PDCA-1+, CD11clo, B220+ cells) are Fas negative before activation (thick black line), but express Fas after overnight stimulation in vivo with LPS (thick red line) or CpG (thick blue line). Thin lines: corresponding populations in a FasKO mouse. E. In vivo activated Fas+ DC express high levels of the costimulatory molecule CD86 (thick red line, gated on Fas+,CD11chi cells). Thick black line: CD86 expression by non-activated CD11chi cells; thin lines: respective negative controls. F,G. Fas expression by myeloid BMDC (thick black line) is further up-regulated (thick colored lines) by overnight treatment in vitro with LPS (red) (F), or interferon ß (blue) (G). Thin lines: negative controls without anti-Fas antibodies. These plots are from the same experiment; thus the negative control curves are the same. H. Summary data on Fas expression by BMDC stimulated by LPS or Type I interferon. MFI: mean fluorescence intensity±SE. I. In vitro activated (by LPS, red line, or interferon ß, blue line) Fas+ BMDC express high levels of the co-stimulatory molecule CD86 compared to non-stimulated cells (black line).
Figure 2
Figure 2. Deletion of Fas from DC in CD11c-Cre.FasKI mice
A. GFP expression (reflecting expression of Cre recombinase driven by the CD11c promoter) by lymph node DC from CD11c-Cre strains 4272 (blue line) and 4097 (red line). Black line - non-transgenic littermate. B. GFP is expressed by CD11chi,CD11b+ cells (blue line) and CD1chi,CD8+ cells (green line). CD11c-Cre strain 4097 was used in B-D. C. Plasmacytoid DC (PDCA-1+, CD11clo, B220+) express a low level of GFP (red line) as expected for CD11c-regulated expression. Black line: non-transgenic littermate. D. Lack of GFP expression by T cells (CD4++CD8+ cells) (blue line) and by B cells (red line) in CD11c-Cre mice. Black line- control staining of total spleen from a non-transgenic mouse. E. Fas expression is lost from GFP+ DC in the spleens of 4272 strain homozygous for FasKI (blue line) but not from GFP+ DC in heterozygous (FasKI/+) control mice (black line). F. Fas expression is lost from the majority of LPS-treated BMDC of 4097 CD11c-Cre.FasKI mice (red line) compared to control CD11c-Cre DC (thick black line). BMDC from a FasKO mouse were used as negative control (thin black line). G. Fas expression is lost from lymph node plasmacytoid DC in 4097 CD11c-Cre.FasKI mice. PDCA-1+ cells from a Cre+FasKI mouse (red line), a Cre+Fas-sufficient littermate (thick black line) and a FasKO mouse (black line) were compared 24 hrs after in vivo treatment with CpG. H-J LPS-activated BMDC from control 4097 CD11c-Cre mice were sensitive to FasL mediated killing in vitro (H) compared to CD11c-Cre.FasKI mice (I). Propidium-iodide staining of CD11c+,GFP+ DC incubated overnight with control CT26 (blue line) or human FasL-transfected CT26−95L carcinoma cells (black line). J, % cytotoxicity was calculated using the formula (a-b/a)×100%, where a and b are % of live CD11c+GFP+ cells incubated with FasL-negative and FasL-positive CT26 cells, respectively. Mean from three experiments, p=0.03. K. LPS-activated, peptide loaded splenic DC were killed in vivo in an antigen- and Fas-dependent manner by OT-1 T cells. Cytotoxicity (%) was calculated using the formula 100%×(a-b)/a, where ‘a’ is a ratio between DC incubated with SIINFEKL (labeled with a high dose of CFSE) and DC treated with irrelevant peptide (labeled with a low dose of CFSE) before injection of the mixture into mice, and ‘b’ is the ratio between the same groups after exposure to OT-1 T cells in vivo. Left bar – mixture of differentially labeled DC from B6 control mouse; right bar – mixture of DC from lpr/lpr mouse. Mean of four individual animals per group is shown. L. Killing of activated BMDC in vitro by OT-1 T cells was Fas-ligand dependent. Equal numbers of BMDC labeled with two concentrations of CFSE were exposed to activated OT-1 (black bars) or FasL.KO OT-1 (open bars) T cells in the presence of specific peptide (CFSEhi cells) or without specific peptide (CFSElo cells), mixed and analyzed by flow cytometry. Cytotoxicity was calculated using the formula 100%×(a-b)/a, where ‘a’ is a ratio of CFSElo to CFSEhi BMDC incubated without T cells, and “b” is the ratio of the same cells incubated with T cells. M-O. DCs accumulate in CD11c-Cre.FasKI mice with age. Six mo old strain 4272 CD11c-Cre-FasKI mice (M) show a larger % of CD11chi in the spleens of Cre+ mice (three animals of each type compared in the same experiment, p=0.006). In five mo old strain 4097 CD11c-Cre.FasKI mice (N) an increase in % of CD11c+ cells, p=0.1 and absolute number (O) of CD11c+ cells, p=0.035 were observed (four animals of each type were compared).
Figure 3
Figure 3. Accelerated development of GVH reaction (ANA production) in recipient mice with Fas-negative APC
NOD.scid or NOD.scidlpr/lpr recipients were inoculated i.p. with 2×10⁷ splenocytes of MHC-compatible B6g7 mice. ANA were detected by staining of HEp-2 cells with sera samples diluted 1:100. ANA values are shown for individual mice. Relative scale (examples shown on the right): 0 – normal 8 wk-old B6 mouse serum, 10 – serum of 1 yr old B6lpr/lpr mouse. See also Supplemental Figure 4 for explanation of ANA evaluation.
Figure 4
Figure 4. Deletion of Fas in DC leads to systemic autoimmunity
A. Cd11c-Cre.FasKI mice produce ANA. Sera from female mice of the indicated ages were tested at 1:100 dilution. Values are shown for individual mice. Cre-negative FasKI littermates were used as controls. B. Hyperglobulinemia in Cd11c-Cre.FasKI mice. IgM and IgG detection by ELISA in sera of 4272 CD11c.Cre-FasKI mice (green lines and bars) or their Cre-negative littermates (red lines and bars). Left panels show the difference in relative concentration of Ig (OD in ELISA assay, lines represent individual mice); right panels show the difference in absolute concentrations of IgM or IgG. The p values (for absolute concentrations) were 0.05 and 0.04 for IgM and IgG, respectively. Results for strain 4097 can be found in Supplemental Figure 5. C. DCs that accumulate in CD11c-Cre.FasKI mice with age are activated and express high level of CD86 in cells positive for GFP (red line). Blue line: DC from Fas-sufficient littermates; thin lines: negative controls (GFP+-Fas-sufficient mice). D. CD11c-Cre.FasKI mice develop splenomegaly. Spleen weights were measured in six mo old strain 4272 CD11c-Cre.FasKI female mice (3 Cre-negative and 3 Cre-positive FasKI mice, p=0.004) and five mo old strain 4097 CD11c-Cre.FasKI female (4 control FasKI, 5 Cre+FasKI mice) and male (7 control FasKI, 6 Cre+ FasKI) animals. There was no significant difference between female and male Cre+FasKI spleen weights (p=0.75). E. Pathological changes in spleens and livers of CD11c-Cre.FasKI mice (right column:b, d, f, h-j) compared to Fas-sufficient littermates (left column: a, c, e,g). Loss of splenic follicular architecture (b), expansion of DC in the spleen (d, CD8+ cells stained with anti-CD8-PE and DCs are counterstained with anti-CD11c-FITC in addition to GFP fluorescence in c and d), altered localization of DC in periarteriolar lymphoid sheath (f, B cells counterstained with anti-CD19-PE antibodies in e and f ); polymorphic infiltrates around central veins in the liver (h, i where i is an enlargement of h) containing CD11c+ cells (stained with anti-CD11c-FITC in addition to GFP fluorescence) (j). Cre-negative FasKI littermates show normal follicular structure (a), lower numbers of DC (c,e), and localization of DC within bridging channels (e) in the spleen and normal liver structure (g). Bar:100μm.
Figure 5
Figure 5. Autoimmunity in mice with Fas deletion in B cells
A. Flow cytometric analysis shows the specificity of Fas deletion by Cre in CD19-Cre.FasKI mice. T and B cells from Fas knock-out (FasKO) animals were used as negative controls. B. Massive proliferation of T and B lymphocytes. Left panel: example of enlarged spleens and lymph nodes in a one year old CD19-Cre.FasKI mouse (left), compared to a Cre-negative littermate (right). Right panel: splenomegaly in >6 mo old CD19-Cre.FasKI female (n=7) and male (n=5) mice (white bars) compared to Cre-negative littermate females (n=5) and males (n=11) (black bar). Splenomegaly was not significantly different between females and males (p=0.6). C. Both B and T cells expand in lymph nodes and spleens of CD19-Cre.FasKI mice. % of CD4+, CD8+, and B cells (defined as B220+CD3) ±SE shown for FasKI controls (black bars) and CD19-Cre.FasKI littermates (white bars). D. CD19-Cre.FasKI mice produce ANA. Dots represent sera obtained from individual 6+ mo old female mice tested at 1:100 dilution. Relative staining was 1.6±0.7 and 6.7±0.8 in Cre and Cre+ FasKI mice respectively.
Figure 6
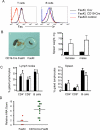
Figure 6. Loss of Fas by T cells does not regulate T cell responses to strong antigens, but leads to systemic autoimmunity
A. Flow cytometric analysis shows the specificity of Fas deletion by Cre in Lck-Cre.FasKI mice. T and B cells from Fas knock-out (FasKO) animals were used as negative controls. B. Lck-Cre.FasKI, Cre-negative FasKI and B6lpr/lpr mice were immunized in the footpads with 50μg OVA mixed 1:1 with Complete Freund's Adjuvant. Regional lymph node cells were stimulated 11 days later in vitro overnight with OVA, and IFNγ secretion was detected by ELISPOT. Ordinate: mean number of dots (from triplicate wells) is shown adjusted to the frequency of CD4+ T cells determined by flow cytometric analysis on the day of the experiment. Symbols show individual mice. C. GZB-Cre.FasKI.OT-1 transgenic Ly5.2 marked T cells and Ly5.1-marked OT-1 T cells were co-injected in Ly5.1+Ly5.2+ mice and their fate was followed after infection with Lm-OVA. Details of experimental design are shown in Supplemental Figure 7. T cells from GZB-Cre.FasKI.OT-1 donors (top panels) show significant loss of Fas 1−2 weeks after activation with OVA expressed by bacteria compared to OT-1 T cells (middle panels). The survival of activated cells from GZB-Cre.FasKI.OT-1 and wild-type OT-1 mice did not differ: Absolute numbers of OT-1vs GZB-Cre.FasKI.OT-1 T cells were 1.0×10⁶ vs. 1.2×10⁶ at day 7 and 1.7×10⁵ vs. 1.6×10⁵ on day 14, respectively. In addition, similar %s of IFNγ producing cells were found in both populations (bottom panels). Representative plots are shown. Bold line –GZB-Cre.FasKI.OT-1 T cells; shaded histogram – OT-1 T cells from the same adoptive host gated using Ly5 alleles. D. Primary (1°) and secondary (2°) responses to minor histocompatibility antigen H60 are not different in GZB-Cre.FasKI mice compared to Cre-negative littermates. Note that there is no primary response at day 4 after immunization, thus only recall responses are compared at day 4 after secondary i.p. immunization with 2×10⁷ C.B10 splenocytes. Ordinate: % of CD8+ T cells in PBL that are H60-tetramer-positive. Primary and secondary immunizations are marked by arrows. Data shown for individual mice traced in two separate experiments (triangles and squares, respectively). Black symbols – GZB-Cre.FasKI; open symbols – control mice. E. ANA formation in GZB-Cre.FasKI mice. Sera from GZB-Cre.FasKI mice (n=11) or Cre-negative littermates (n=9) 6 mo of age or older were used at 1:100 dilution. Relative scores were 2.2± 0.4 and 6.3±0.8 in Cre and Cre+ FasKI mice respectively. F. Splenic cellularity in 8−10 mo old GZB-Cre. FasKI mice was not significantly greater than in control Cre-negative littermates. (p=0.215, 9 control and 19 Cre+ mice were used). G. Lck-Cre.FasKI mice produce ANA. Sera obtained from individual 6+ mo old female mice (6 FasKI and 13 Lck-Cre.FasKI animals) were tested at 1:100 dilution. Relative scores were 0.5± 0.3 and 5.3±0.9 in Cre and Cre+ FasKI mice respectively.
Figure 7
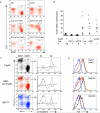
Figure 7. CD3+B220+ cell development is T cell-autonomous and requires prior T cell activation
A. Examples of flow cytometric analyses showing the presence of CD3+B220+ cells in mice with Fas deletion in T cells (Lck-Cre.FasKI and GZB-Cre.FasKI) and APC (CD11c-Cre.FasKI and CD19-Cre.FasKI). All mice were 6+ months of age. B. Elevated frequencies of CD3+B220+ splenocytes were found only in mice with T cell deletion of Fas including GZB-Cre.FasKI, which delete Fas upon activation only. All animals were over 6 months old. n – number of animals per group. The degree of variation in the numbers of CD3+B220+ cells in individual mice must reflect their origin from T cells activated randomly by autoimmune or environmental stimuli. C,D. In GZB-Cre.FasKI mice, B220+ T cells lose expression of Fas. Splenocytes from Cre-negative FasKI, GZB-Cre.FasKI and B6lpr/lpr mice were stained with antibodies against Thy1.2 pan-T cell marker, B220, and a combination of anti-co-receptor antibodies (a mixture of anti-CD4 and anti-CD8 labeled with the same fluorochrome) (C). Gate 1 – Thy1.2+,B220 cells, Gate2 – Thy1.2+,B220+ cells. The latter were electronically separated into Thy1.2+,B220+, co-receptor+ cells (Gate 2a) and Thy1.2+,B220+, co-receptor cells (Gate 2b). Gated cells were further analyzed for Fas expression (D). Line color reflects mouse genotype (shown in C).

Comment in

Similar articles

Cited by

References

    1. Arai H, Chan SY, Bishop DK, Nabel GJ. Inhibition of the alloantibody response by CD95 ligand. Nat Med. 1997;3:843–848. - PubMed
    1. Bevan MJ, Fink PJ. The CD8 response on autopilot. Nat Immunol. 2001;2:381–382. - PubMed
    1. Brocker T, Riedinger M, Karjalainen K. Targeted expression of major histocompatibility complex (MHC) class II molecules demonstrates that dendritic cells can induce negative but not positive selection of thymocytes in vivo. J Exp Med. 1997;185:541–550. - PMC - PubMed
    1. Brunner T, Mogil RJ, LaFace D, Yoo NJ, Mahboubi A, Echeverri F, Martin SJ, Force WR, Lynch DH, Ware CF, et al. Cell-autonomous Fas (CD95)/Fas-ligand interaction mediates activation-induced apoptosis in T-cell hybridomas. Nature. 1995;373:441–444. - PubMed
    1. Chen M, Wang YH, Wang Y, Huang L, Sandoval H, Liu YJ, Wang J. Dendritic cell apoptosis in the maintenance of immune tolerance. Science. 2006;311:1160–1164. - PubMed

Publication types

MeSH terms