. 2007 Jun;117(6):1679-89.
doi: 10.1172/JCI30565. Epub 2007 May 17.

Upregulation of myocellular DGAT1 augments triglyceride synthesis in skeletal muscle and protects against fat-induced insulin resistance

Affiliations

Upregulation of myocellular DGAT1 augments triglyceride synthesis in skeletal muscle and protects against fat-induced insulin resistance

Li Liu et al. J Clin Invest. 2007 Jun.

Abstract

Increased fat deposition in skeletal muscle is associated with insulin resistance. However, exercise increases both intramyocellular fat stores and insulin sensitivity, a phenomenon referred to as "the athlete's paradox". In this study, we provide evidence that augmenting triglyceride synthesis in skeletal muscle is intrinsically connected with increased insulin sensitivity. Exercise increased diacylglycerol (DAG) acyltransferase (DGAT) activity in skeletal muscle. Channeling fatty acid substrates into TG resulted in decreased DAG and ceramide levels. Transgenic overexpression of DGAT1 in mouse skeletal muscle replicated these findings and protected mice against high-fat diet-induced insulin resistance. Moreover, in isolated muscle, DGAT1 deficiency exacerbated insulin resistance caused by fatty acids, whereas DGAT1 overexpression mitigated the detrimental effect of fatty acids. The heightened insulin sensitivity in the transgenic mice was associated with attenuated fat-induced activation of DAG-responsive PKCs and the stress mediator JNK1. Consistent with these changes, serine phosphorylation of insulin receptor substrate 1 was reduced, and Akt activation and glucose 4 membrane translocation were increased. In conclusion, upregulation of DGAT1 in skeletal muscle is sufficient to recreate the athlete's paradox and illustrates a mechanism of exercise-induced enhancement of muscle insulin sensitivity. Thus, increasing muscle DGAT activity may offer a new approach to prevent and treat insulin resistance and type 2 diabetes mellitus.


Figures

Figure 1
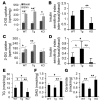
Figure 1. Upregulation of myocellular DGAT increases intracellular TG levels and decreases intracellular DAG levels.
(AC) Overexpression of DGAT1 via recombinant adenovirus (Dgat1) in differentiated C2C12 myocytes, showing DGAT activity levels (A), TG content (B), and DAG level (C) compared with mock-transduced cells or cells transduced with a control recombinant adenovirus expressing GFP. (DG) Exercise-induced DGAT activation (D) and changes in myocellular TG (E), DAG (F), and ceramide (G) levels in isolated soleus muscles from 3-month-old male mice after 1 week swimming training (Swim; n = 6) as compared with age-, gender-, and diet-matched sedentary mice (Ctrl; n = 4). *P < 0.05; **P < 0.01.
Figure 2
Figure 2. Transgenic mice with DGAT1 overexpression in skeletal muscle.
(A) The Dgat1 transgene contains (from the 5′ end to the 3′ end) the 3.3-kb MCK promoter, a human Dgat1 cDNA containing its own initiation and termination codons, and the genomic sequence of human growth hormone (hGH) containing the last 3 exons and 2 introns as indicated. (B) Tissue distribution of the Dgat1 transgene mRNA levels measured by reverse transcription and PCR amplification. S. intestine, small intestine; gastro., gastrocnemius. (C) RT-PCR quantification of total DGAT1 and DGAT2 mRNA levels in soleus muscles of WT and transgenic mice (n = 5 in each group). (D) Total DGAT activity levels in membrane fractions of soleus muscles from WT and transgenic mice (n = 5 in each group). **P < 0.01.
Figure 3
Figure 3. Myocellular DGAT1 overexpression reproduces the athlete’s paradox and protects against FA-induced insulin resistance.
(A and B) Muscle TG (A) and DAG and ceramide (B) contents in soleus muscles isolated from WT and transgenic mice on NC diet. (C and D) Muscle TG (C) and DAG and ceramide (D) contents in soleus muscles isolated from WT and transgenic mice after 8 weeks of HFD treatment. (E) Representative cross-sections of soleus muscles from HFD-fed WT and MCK-Dgat1 transgenic mice, stained for neutral lipids (primarily TG) with oil red O. (FH) GTT in age- and diet-matched male WT (n = 9) and transgenic (n = 5) mice on NC diet (F), HFD for 5 weeks (G), or HFD for 8 weeks (H). (I) ITT in age-matched male WT and transgenic mice on NC diet or HFD for 8 weeks. #P < 0.05 compared with HFD-fed WT mice. (J) Quantification of total and percentage of membrane-bound GLUT4 in soleus muscles isolated from WT mice on NC diet, WT mice on HFD, and transgenic mice on HFD. The quantification is based on Western blot analysis of the myocellular membrane-bound (Mb) and cytosol (Cyt) fractions of GLUT4 (n = 4 in each group); a typical Western blot is presented as an inset. (K) Quantification of total and percentage of membrane-bound GLUT1 from the muscle specimens described in J. *P < 0.05; **P < 0.01.
Figure 4
Figure 4. Muscle insulin sensitivity and its response to FA challenges are DGAT1 genotype dependent.
(A) Ex vivo basal and insulin-stimulated (Stim) 2-deoxyglucose (2-DG) uptake in isolated soleus muscles from WT (n = 4), MCK-Dgat1 transgenic (n = 6), and Dgat1-knockout (n = 4) mice without FA pretreatment. (B) Relative insulin-stimulated 2-DG uptakes as measured by the difference between insulin-stimulated and basal 2-DG uptakes divided by the basal uptake. Data are derived from the experiment described in A. (C) Ex vivo basal and insulin-stimulated 2-DG uptake in isolated soleus muscles from WT (n = 6), Dgat1 transgenic (n = 5), and Dgat1-knockout (n = 5) mice after the muscles were pretreated with 0.75 mM FA for 2 hours. (D) Relative insulin-stimulated 2-DG uptakes were calculated as in B; data are derived from the experiment described in C. TG (E), DAG (F), and ceramide (G) contents in soleus muscles isolated from WT (n = 4), Dgat1 transgenic (n = 5), and Dgat1-knockout (n = 4) mice after the muscles were pretreated with 0.75 mM FA for 2 hours. *P < 0.05; **P < 0.01.
Figure 5
Figure 5. DGAT1-mediated protection against FA-induced insulin resistance in skeletal muscle involves DAG-PKC and its downstream signal transduction.
(A) An inverse correlation was found between muscle TG levels with glucose AUC levels in GTT. Adjusted R2 = 0.126; P = 0.084. (B) Positive correlation between muscle DAG levels with glucose AUC levels. Adjusted R2 = 0.515; P = 0.001. Data in A and B are from NC-fed and HFD-fed MCK-Dgat1 mice. (CE) Membrane-bound PCK activity levels of all isoforms combined (C), the conventional isoform PKCβ2 (D), and the atypical isoform PKCλ (E) in soleus muscles from NC-fed WT mice (n = 4), HFD-fed WT mice (n = 4), and HFD-fed transgenic mice (n = 4). (F) Percentages of membrane-bound PCK activity levels of all isoforms combined, PKCβ2, and PKCλ in NC-fed WT, HFD-fed WT, and HFD-fed Dgat1 mice. (G) Western blots for total and phosphorylated JNK1 (p-JNK1; Thr183/Tyr185), total and phosphorylated IRS-1 (p–IRS-1; Ser307), and total and phosphorylated Akt (p-Akt; Ser473) in muscle specimens from NC-fed WT, HFD-fed WT, and HFD-fed Dgat1 mice, as indicated. Densitometry was used to quantify phosphorylated proteins (in arbitrary units) as shown at right (n = 3 in each group). (H) Assessment of the IKKβ–NF-κB pathway. Top: Western blot for muscle IκB-α levels from WT mice on NC diet, WT mice on HFD, and Dgat1 mice on HFD. Bottom: EMSAs for muscle NF-κB activity levels in NC-fed WT, HFD-fed WT, and HFD-fed Dgat1 mice. hp, hot probe; cp, cold probe; NS, no statistical significance. Densitometric quantification (in arbitrary units) is shown at right (n = 3 in each group). *P < 0.05; **P < 0.01.
Figure 6
Figure 6. Insulin-induced Akt phosphorylation and GLUT4 membrane translocation in muscles from MCK-Dgat1 and WT mice.
(A) Levels of total Akt, phosphorylated Akt (Ser473), total GLUT4, and membrane-bound GLUT4 in muscle specimens from HFD-fed WT and MCK-Dgat1 transgenic mice. Muscles were incubated in the presence (+) or absence (–) of 100 nM insulin for 30 minutes before tissue homogenates or membrane fractions were prepared and analyzed by Western blot. (B) Ratios of phosphorylated Akt to total Akt and membrane-bound GLUT4 to total GLUT4 in WT and MCK-Dgat1 muscles at the basal and insulin-stimulated states. The values are means from 2 experiments. Percent increases shown in each panel for insulin-stimulated Akt phosphorylation or GLUT4 membrane translocation were calculated as (insulin – basal)/basal.
Figure 7
Figure 7. Models for fat-induced insulin resistance in obesity and protection by exercise-induced augmentation of TG synthesis.
This model assumes that excessive accumulation of certain intramyocellular FA-derived lipid metabolites is lipotoxic and is a cause for muscle insulin resistance. In this model, both the terminal catabolic pathway (CAT) of FA oxidation and the anabolic pathway (ANA) of TG synthesis are viewed as beneficial in removing potentially lipotoxic FA derivatives from myocytes. In obesity, the primary driving force for increased myocellular TG levels is FA overload of myocytes. Because of the increased intracellular FA substrates, not only are TG levels increased, but levels of lipotoxic FA derivatives are also increased, leading to muscle insulin resistance. Exercise upregulates DGAT1, which increases the TG synthesis capacity. This also increases TG formation but reduces FA substrate levels, resulting in decreased formation of lipotoxic FA derivatives. Thus, upregulation of myocellular DGAT1 is protective against FA-induced insulin resistance.

Comment in

  • J Clin Invest. 117:1690.

References

    1. Unger R.H. Lipotoxic diseases. Annu. Rev. Med. 2002;53:319–336. - PubMed
    1. Yu Y.H., Ginsberg H.N. The role of acyl-CoA:diacylglycerol acyltransferase (DGAT) in energy metabolism. Ann. Med. 2004;36:252–261. - PubMed
    1. Phillips D.I., et al. Metabolism. Vol. 45. 1996. Intramuscular triglyceride and muscle insulin sensitivity: evidence for a relationship in nondiabetic subjects. pp. 947–950. - PubMed
    1. Ebeling P., et al. Intramuscular triglyceride content is increased in IDDM. Diabetologia. 1998;41:111–115. - PubMed
    1. Manco M., et al. Insulin resistance directly correlates with increased saturated fatty acids in skeletal muscle triglycerides. Metabolism. . 2000;49:220–224. - PubMed

Publication types

MeSH terms