. 2007 May;3(5):e92.
doi: 10.1371/journal.pcbi.0030092.

Predictive modeling of signaling crosstalk during C. elegans vulval development

Affiliations

Predictive modeling of signaling crosstalk during C. elegans vulval development

Jasmin Fisher et al. PLoS Comput Biol. 2007 May.

Abstract

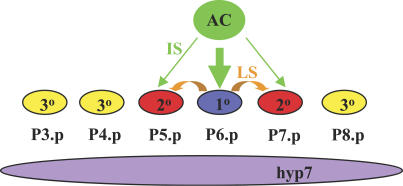
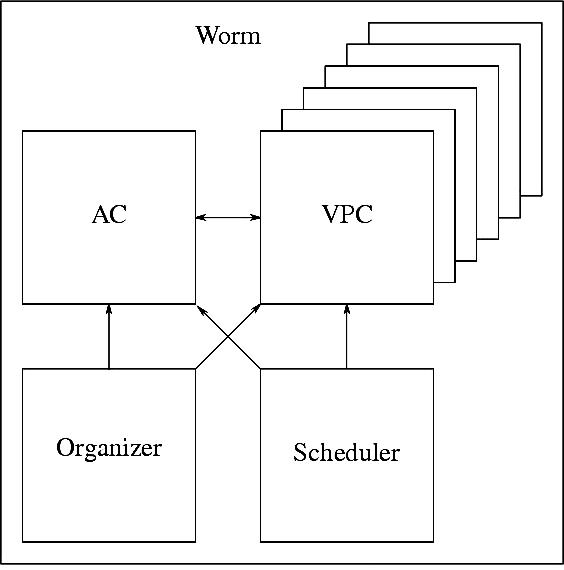
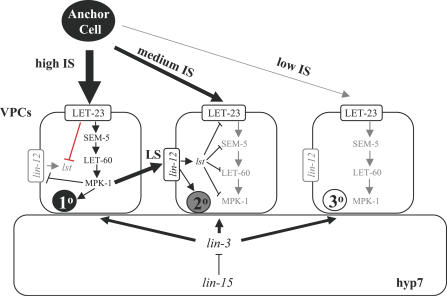
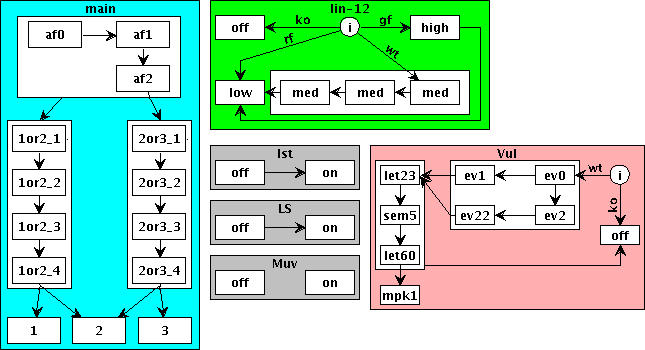
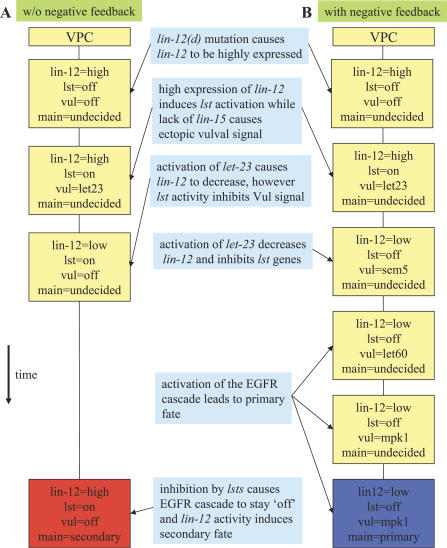
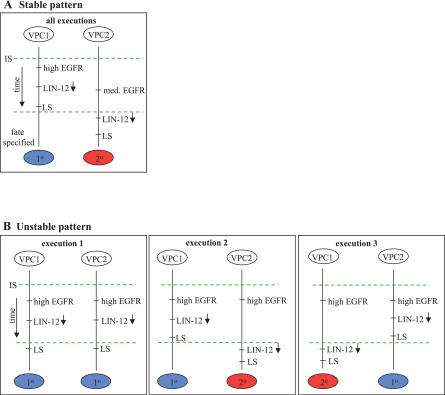
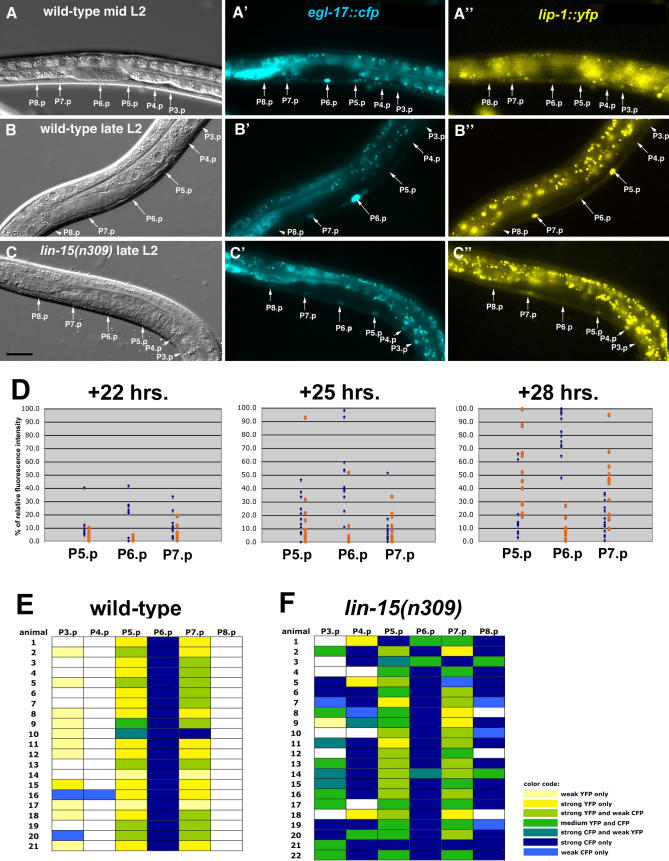
Caenorhabditis elegans vulval development provides an important paradigm for studying the process of cell fate determination and pattern formation during animal development. Although many genes controlling vulval cell fate specification have been identified, how they orchestrate themselves to generate a robust and invariant pattern of cell fates is not yet completely understood. Here, we have developed a dynamic computational model incorporating the current mechanistic understanding of gene interactions during this patterning process. A key feature of our model is the inclusion of multiple modes of crosstalk between the epidermal growth factor receptor (EGFR) and LIN-12/Notch signaling pathways, which together determine the fates of the six vulval precursor cells (VPCs). Computational analysis, using the model-checking technique, provides new biological insights into the regulatory network governing VPC fate specification and predicts novel negative feedback loops. In addition, our analysis shows that most mutations affecting vulval development lead to stable fate patterns in spite of variations in synchronicity between VPCs. Computational searches for the basis of this robustness show that a sequential activation of the EGFR-mediated inductive signaling and LIN-12 / Notch-mediated lateral signaling pathways is key to achieve a stable cell fate pattern. We demonstrate experimentally a time-delay between the activation of the inductive and lateral signaling pathways in wild-type animals and the loss of sequential signaling in mutants showing unstable fate patterns; thus, validating two key predictions provided by our modeling work. The insights gained by our modeling study further substantiate the usefulness of executing and analyzing mechanistic models to investigate complex biological behaviors.


Conflict of interest statement

Competing interests. The authors have declared that no competing interests exist.

Figures

Figure 1
Figure 1. Signaling Events Involved in VPC Fate Specification
IS, inductive signal; LS, lateral signal.
Figure 2
Figure 2. Modules Composing the Worm Vulva Model
Communication between modules is marked by arrows. Communication between VPCs is not depicted.
Figure 3
Figure 3. Conceptual Model for the Signaling Events Underlying VPC Fate Specification
The thickness of the inductive signal (IS) arrows indicates the relative levels received by the three VPCs shown. With a low level of IS (the rightmost cell), the EGFR/RAS/MAPK pathway is below the threshold needed for induction (indicated in grey), and the VPC adopts the 3° fate. A high level of IS (the leftmost cell) activates the EGFR/RAS/MAPK pathway and induces the 1° fate. High IS also results in the production of a strong lateral signal (LS) by this VPC, the downregulation of LIN-12, and, as predicted by our computational model (see below), in the inhibition of the lst genes as indicated by the red line. The middle VPC receives a medium IS; however, the EGFR/RAS/MAPK pathway is counteracted (indicated in grey) by the lst genes activated by the strong LS from the leftmost VPC. The middle VPC thus adopts the 2° fate.
Figure 4
Figure 4. Graphic Visualization of the VPC Module
Each rectangle represents a possible value, and arrows represent possible value changes (according to conditions on values of other components). The “main” component follows the progress of the cell toward fate assumption. The cell starts as undifferentiated (af); according to the activities in the EGFR and LIN-12 / Notch pathways, it decides whether to adopt a vulval (1or2) or a nonvulval (2or3) cell fate. Finally, the cell assumes one of the three cell fates. The smaller rectangles correspond to time delays until these decisions are made. Other components represent the activity level of the biological components they are associated with (lin-12, EGFR pathway, lst genes, LS, lin-15). Our tool also enables visualization of executions of this model by highlighting the current value of each component. Changes in highlighted values allow us to follow the execution visually.
Figure 5
Figure 5. Simulation of the Model in the Absence (A) and Presence (B) of a Negative Feedback from EGFR to lst Genes
Each rectangle represents a snapshot of the state of a VPC. Time flows from top to bottom and the changes in values of components represent the evolvement of simulation. Both simulations are according to the mutation lin-12(gf);lin-15(o). Both simulations start with lin-12 activated (according to lin-12(gf) mutation), and let-23 activated (according to lin-15(o), no inhibition from hyp-7). (A) lin-12 activates lst. Activation of let-23 inhibits lin-12; however, activation of lst prevents activation of sem-5. EGFR is counteracted and the cell assumes a 2° fate (red). (B) Inhibition of let-23 on lst prevents lst activation. The EGFR pathway is fully activated and the cell assumes a 1° fate (blue).
Figure 6
Figure 6. Order of Events in Stable and Unstable Fate Patterns
Time flows from top to bottom. Two events that appear on the same vertical line are ordered according to the time flow. The dashed lines synchronize the different vertical lines. All events that appear above a synchronization line occur before all events that appear below the synchronization line. The time-order between two events that appear on parallel vertical lines without a synchronization line is unknown. (A) Proposed sequence of events leading to a stable pattern. The left time line starts with a high inductive signal (IS) and the right time line with a medium IS. (B) Three diagrams that represent possible sequences of events leading to different fate patterns in the absence of IS (the AC is absent). Execution 1 represents the case where two cells are strongly coupled and they both reduce their lin-12 level simultaneously, send LS, which is ignored, and assume primary fates. Execution 2 represents the case where the left cell sends the lateral signal slightly before its neighbor reduces the level of lin-12, thus resulting in a 1°-2° pattern. Execution 3 is the dual of execution 2 where the cell on the right inhibits the cell on the left.
Figure 7
Figure 7. Experimental Validation of the Model's Predictions
(A,B) As examples for the time-course analysis, a mid-L2 larva at +22 h (A–A″) and a late L2 larva at +28 h (B) are shown. For each animal, the Nomarski, CFP (‘), and YFP (‘') channels are shown. (C–C″) Example of a lin-15(n309) larva at the late L2 stage showing simultaneous expression of EGL-17::CFP and LIP-1::YFP in P7.p, P5.p, and P4.p. All images were taken with identical camera and microscope settings. Scale bar in C is 10 μm. (D) Quantification of the EGL-17::CFP (blue dots) and LIP-1::YFP (orange dots) signals in P5.p, P6.p, and P7.p of ten to 12 animals for each time point. The relative fluorescence intensities are shown as percent values of the maximal EGL-17::CFP and LIP-1::YFP signals, respectively, observed during the time-course analysis. (E,F) Semiquantitative representation of the EGL-17::CFP and LIP-1::YFP expression patterns observed in the VPCs of wild-type (E) and lin-15(n309) (F) late L2 larvae. Signal intensities were classified as indicated by the color legend on the right.

Similar articles

Cited by

References

    1. Fisher J, Henzinger TA. Executable biology. In Proceedings of the 39th Winter Simulation Conference; Track on Modeling and Simulation in Computational Biology; 3–6 December, 2006;; Monterey, California, United States.. Monterey (California): IEEE Computer Society Press; 2006. pp. 1675–1682.
    1. Fisher J, Harel D, Hubbard EJ, Piterman N, Stern MJ, et al. Combining state-based and scenario-based approaches in modeling biological systems. Lecture Notes Comp Sci; CMSB;; 26–28 May 2004;; Paris, France.. 2004. pp. 236–241. In. Proceedings of the 2nd International Conference on Computational Methods in Systems Biology.
    1. Fisher J, Piterman N, Hubbard EJ, Stern MJ, Harel D. Computational insights into Caenorhabditis elegans vulval development. Proc Natl Acad Sci U S A. 2005;102:1951–1956. - PMC - PubMed
    1. Clarke EM, Grumberg O, Peled D. Model checking. Cambridge (Massachusetts): The MIT Press; 1999. 330
    1. Kam N, Harel D, Kugler H, Marelly R, Pnueli A, et al. Formal modeling of C. elegans development: A scenario-based approach. Lecture Notes Comp Sci; CMSB;; 24–26 February 2003;; Roverto, Italy.. 2003. pp. 4–20. In. Proceedings of the First International Workshop on Computational Methods in Systems Biology.

Publication types

MeSH terms

Substances