. 2007 Jul 6;370(2):315-30.
doi: 10.1016/j.jmb.2007.04.034. Epub 2007 Apr 19.

Change in nutritional status modulates the abundance of critical pre-initiation intermediate complexes during translation initiation in vivo

Affiliations

Change in nutritional status modulates the abundance of critical pre-initiation intermediate complexes during translation initiation in vivo

Chingakham Ranjit Singh et al. J Mol Biol. .

Abstract

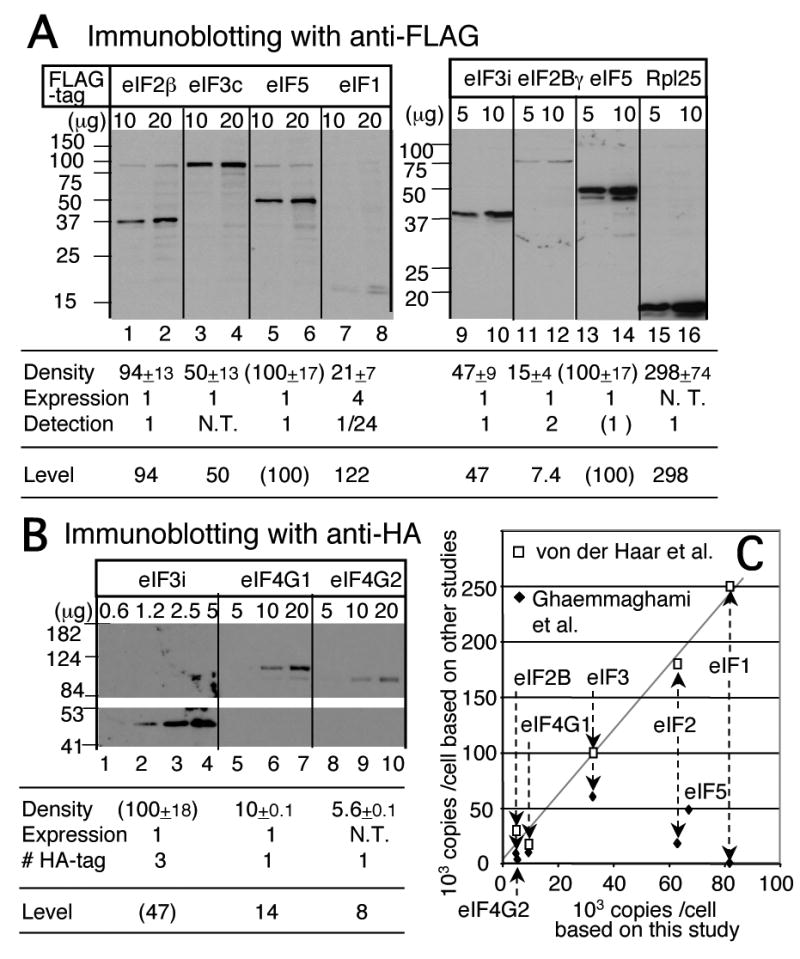
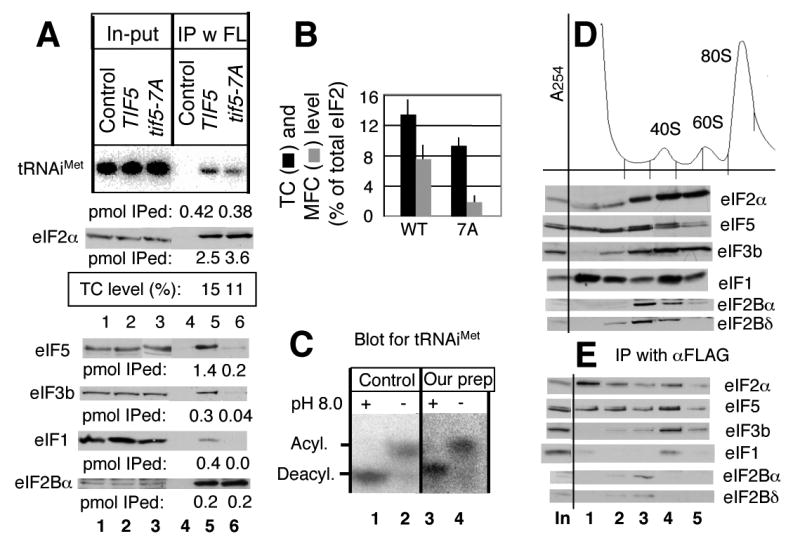
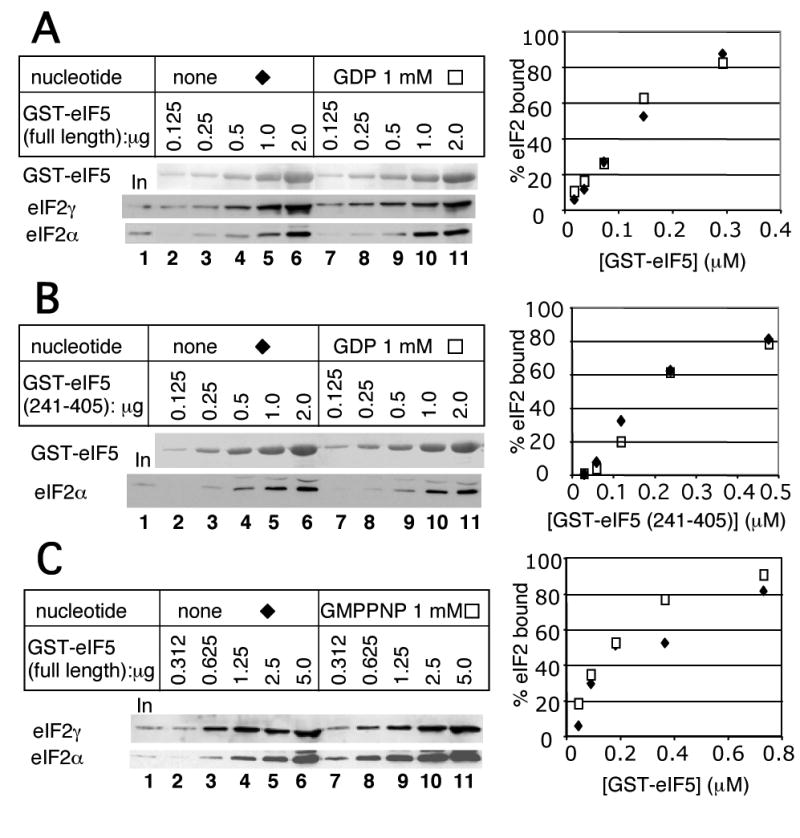
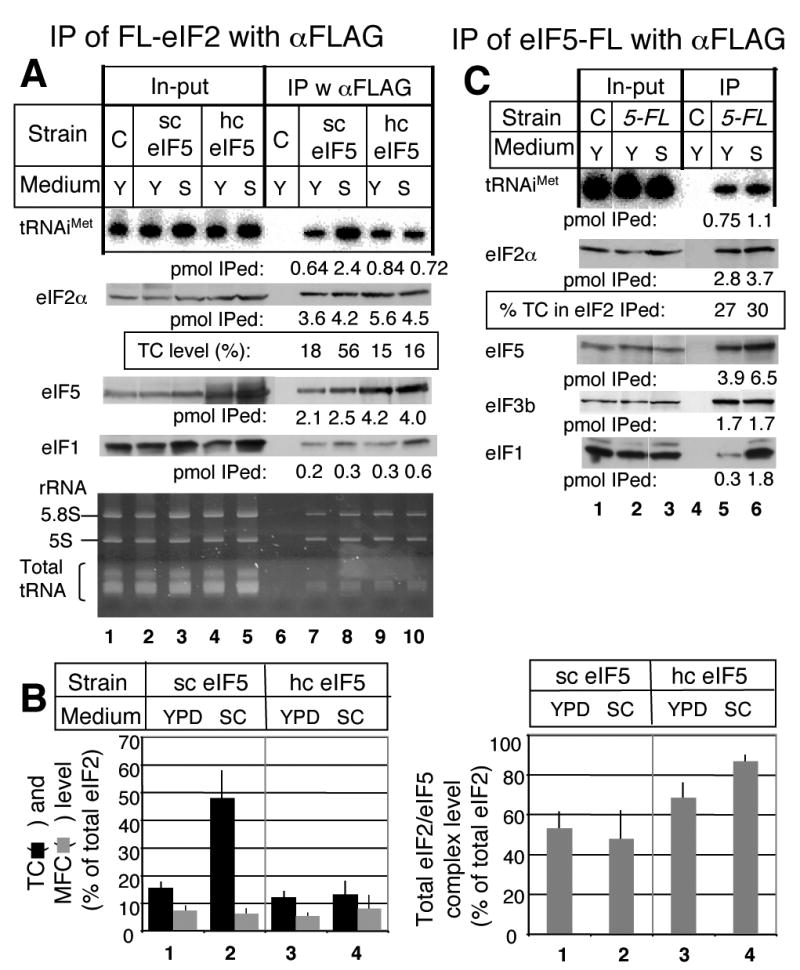
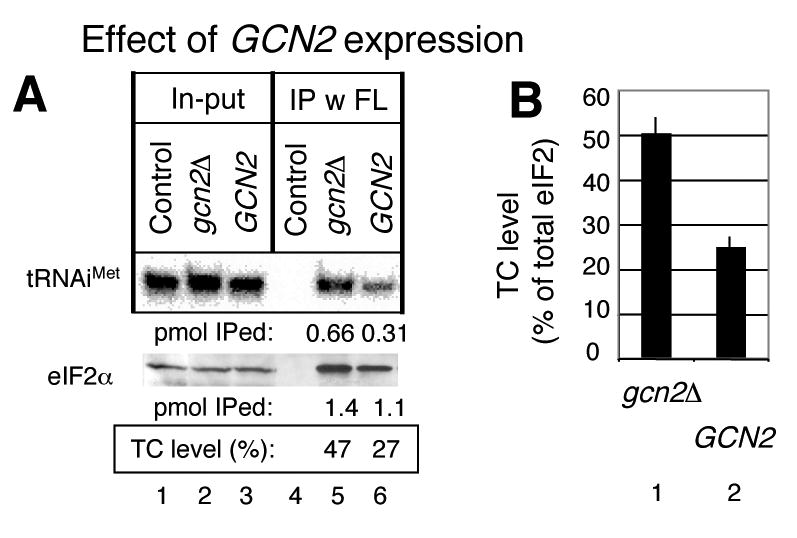
In eukaryotic translation initiation, eIF2GTP-Met-tRNA(i)(Met) ternary complex (TC) interacts with eIF3-eIF1-eIF5 complex to form the multifactor complex (MFC), while eIF2GDP associates with eIF2B for guanine nucleotide exchange. Gcn2p phosphorylates eIF2 to inhibit eIF2B. Here we evaluate the abundance of eIFs and their pre-initiation intermediate complexes in gcn2 deletion mutant grown under different conditions. We show that ribosomes are three times as abundant as eIF1, eIF2 and eIF5, while eIF3 is half as abundant as the latter three and hence, the limiting component in MFC formation. By quantitative immunoprecipitation, we estimate that approximately 15% of the cellular eIF2 is found in TC during rapid growth in a complex rich medium. Most of the TC is found in MFC, and important, approximately 40% of the total eIF2 is associated with eIF5 but lacks tRNA(i)(Met). When the gcn2Delta mutant grows less rapidly in a defined complete medium, TC abundance increases threefold without altering the abundance of each individual factor. Interestingly, the TC increase is suppressed by eIF5 overexpression and Gcn2p expression. Thus, eIF2B-catalyzed TC formation appears to be fine-tuned by eIF2 phosphorylation and the novel eIF2/eIF5 complex lacking tRNA(i)(Met).


Figures

Fig. 1
Fig. 1. Determination of cellular eIF levels
(A) Example of quantitative detection of indicated FLAG-tagged proteins in WCE from yeast strains by immunoblotting with anti-FLAG antibodies. Table summarizes densitometry analysis to determine the expression level relative to eIF5 (set to 100%). FLAG antibody signal density was controlled by the following two factors: (1) Relative expression level of the epitope-tagged protein, compared to the endogenous level of the cognate protein. This was determined by immunoblotting with antibodies raised against each protein (see Fig. S1). (2) Relative detection efficiency of the FLAG-tagged protein, compared to that of eIF5-FL, as determined by anti-FLAG antibodies. (See Fig. 2 below). N. T., not tested due to technical problems or lack of antibodies. (B) Determination of HA-tagged eIF levels. Analysis was done as in panel A but with indicated HA-tagged yeast strains and anti-HA antibodies. (C) Data from Ref. and Ref. plotted against data from this study as empty squares and filled diamonds, respectively. Dotted arrows indicate values for individual eIFs. Grey line indicates the linear regression with the data from . For the data from , the eIF3 and eIF2 levels were averaged from the values for the a/b/c- and α/γ– subunits, respectively. The eIF2B level was averaged from the values for α, β, γ and δ subunits.
Fig. 2
Fig. 2. Transfer and detection efficiency of purified FLAG-eIFs
Indicated amounts of purified proteins were subjected to SDS-PAGE, followed by Coomassie Blue staining (panel A, lanes 1-10) or immunoblotting with anti-FLAG antibodies (panel A, lanes 11-27; panel B). To increase the accuracy of measuring the intensity of anti-FLAG detection per pmol of FLAG-proteins, we ran two separate SDS-PAGE gels at the same time, one loaded with indicated amounts of purified proteins, and the other loaded with four times more of the same proteins. The former was subjected to immunoblotting as shown, and the latter was stained with Coomassie Blue to determine the protein concentrations of the samples in comparison with the amount of eIF5-FL on the same gel. The eIF5-FL sample concentration was determined by comparing to known amounts of BSA, as shown in Panel A, lanes 2-5. The results indicate that the detection efficiency for all expect eIF1 (as in C) and eIF2Bγ is identical. That for eIF2γ is 2.0, because of two copies of the FLAG epitope. (C) The density of anti-FLAG reactivity was plotted against molar amounts of FL-eIF1 or eIF5-FL in each lane.
Fig. 3
Fig. 3. Determination of TC and eIF assembly intermediate levels in vivo and identification of a novel eIF2/eIF5 complex lacking tRNAiMet
(A) 1 mg of WCE prepared from KAY17 (Control), KAY128 (TIF5), and KAY284 (tif5-7A) was used for anti-FLAG immunoprecipitation, and 80 % (top gel) and 20 % (bottom gels) of the precipitated fractions (lanes under IP) were analyzed by northern and western blotting, respectively, with 2% in-put amount (lanes under In-put) and purified tRNAiMet and eIF2 as the standard (not shown), as described under Materials and Methods. The molar amounts (per 1 mg WCE) of precipitated components, calculated in comparison with the band densities of purified components, are listed below each panel. (B) TC and MFC levels. % of tRNAiMet- or eIF3-bound eIF2 compared to total eIF2, observed in KAY128 (WT) and KAY284 (7A), is shown by bars with SD in lines. (C) Confirmation of intact Met-tRNAiMet during TC level determination. Our prep; the RNA samples were isolated from the in-put WCE sample under acidic conditions and analyzed by the acidic urea PAGE and the detection using a probe for tRNAiMet, all as described under Materials and Methods. Control; intact aminoacyl tRNA sample was prepared directly from yeast and analyzed similarly. +; fully deacylated by incubating in 2 M Tris-HCl (pH 8.0) at 37°C, 30 min. -; no alkaline treatment. (D) and (E) Analyses of eIF complexes by sucrose gradient-velocity sedimentation. KAY25 (FL-SUI3) was grown in YPD at 30°C, treated with cycloheximide for 5 min, and then harvested for preparation of WCE, as described previously . 25 A260 units of the WCE were fractionated on 5-45% sucrose gradients by centrifugation at 39000 rpm for 2 h. (D) Top panel, A254 profile indicating the positions of ribosomal species. A half of the first 5 fractions was precipitated with ethanol and analyzed by SDS-PAGE and immunoblotting with antibodies indicated to the right. (E) The reminder of the fractions was incubated with anti-FLAG affinity resin (Sigma) for 30 min, followed by washing 4 times. eIFs in ethanol- or immuno-precipitated fractions were analyzed for immunoblotting together on the same gel, to know the relative amount of FL-eIF2 precipitated. In, 1% of the input amount.
Fig. 4
Fig. 4. The effect of guanine nucleotides on GST-eIF5 binding to purified eIF2
Indicated amounts of GST-fusion forms of full-length eIF5 (A, C) or its CTD (aa. 241-405) (B) were allowed to bind 20 ng of purified eIF2 in the presence of 1 mM guanine nucleotides, indicated across the top, and the complex formed was analyzed by GST pull down, as described previously . Bound eIF2 was visualized by immunoblotting (bottom panels), whereas GST-eIF5 proteins pulled down was visualized by Ponceu S staining (top panel). Graph to the right shows % of eIF2 bound to GST-fusion proteins (in panel A and C, average values for eIF2α and eIF2γ bound) plotted against the concentration of the latter.
Fig. 5
Fig. 5. Comparison of the abundance of eIF2- and eIF5-containing complexes between cells grown in YPD and SC media
(A) Strain KAY128 (FL-SUI3 gcn2Δ; sc eIF5) and its isogenic hc eIF5 derivative KAY482 (hc eIF5), together with a control strain KAY113 carrying an unmodified SUI3 (C), were grown in YPD (Y) or SC (S) medium and subjected to quantitative immunoprecipitation, as in Fig. 3A. Immuno-precipitated fractions were analyzed by Nothern blotting for tRNAiMet (top gel) and immunoblotting for eIF2α (second gel), eIF5 (third gel) and eIF1 (fourth gel) (lanes 6-10), together with 2% of in-put amount (lanes 1-5). Amount of precipitated proteins per 1 mg WCE is presented below each gel in pmol. Bottom gel indicates the position and amount of EtBr-stained 5.8S and 5S rRNA and total tRNA from the same acrylamide gel prior to transfer to a membrane and Northern hybridization. Note that some tRNA non-specifically coprecipitated with the 43S particle in lanes 7-10 and obscured specific tRNAiMet precipitation when examined by EtBr staining alone. (B) The abundance of TC, MFC (left) and total eIF2/eIF5 complex (right) was quantified from (A) and at least three other independent experiments as ratio of co-precipitated tRNAiMet, eIF1 and eIF5, respectively, to total eIF2. (C) Strain KAY35 (gcn2Δ TIF5-FL) and a control strain KAY113 (C) carrying an unmodified TIF5 were grown in YPD (Y) or SC (S) medium and subjected to quantitative immunoprecipitation and the results presented exactly as in Fig. 3A and 4A.
Fig. 6
Fig. 6. Gcn2p expression down-regulates TC formation in the SC medium
(A) Quantitative immunoprecipitation was performed using KAY128 (gcn2Δ FL-SUI3) transformants carrying an empty vector (gcn2Δ) and p722 (GCN2) and a control KAY113 (gcn2Δ SUI3) transformant carrying an empty vector, exactly as in Fig. 3A. The cells were grown in SC-ura medium. (B) TC levels measured from panel (A) and three other independent experiments with SD in lines.
Fig. 7
Fig. 7. The abundance model of eIF2 assembly reactions in S. cerevisiae cells growing in the YPD medium
The right column describes a sequence of eIF2 reactions from the previous round of initiation (Initiation) to the formation of 43S complex (MFC ≃ 43S) for the new round of initiation. The levels of eIF2 intermediate complexes determined in this study were translated into absolute levels, based on the ribosomal level of 200 000 copies/cell and presented in italicized beside the relevant complexes. The following values were used for calculation: Total eIF2 level, 63,000 copies/cell. Total eIF2/eIF5 complex, TC and MFC level, 54%, 15%, and 7.5% of total eIF2, respectively (from Fig. 3A, Fig. 5A and other independent experiments). Total TC/eIF5 complex level, 22% of eIF2 bound to eIF5 (from Fig. 5D and other independent experiments). The left column depicts the dissociation of the ribosome. The level (italicized) and percentage (in parentheses) of the ribosome in each stage are presented. Although we reason that the eIF2/eIF5 complex lacking tRNAiMet is bound to GDP, this needs to be demonstrated in the future.

References

    1. Pestova TV, Lorsch JR, Hellen CUT. The mechanism of translation initiation in eukaryotes. In: Mathews MB, Sonenberg N, Hershey JWB, editors. Translational Control in Biology and Medicine. Cold Spring Harbor Lab Press; Cold Spring Harbor, NY: 2007. pp. 87–128.
    1. Hinnebusch AG, Dever TE, Asano K. Mechanism of translation initiation in the yeast Saccharomyces cerevisiae. In: Mathews MB, Sonenberg N, Hershey JWB, editors. Translational Control in Biology and Medicine. Cold Spring Harbor Lab Press; Cold Spring Harbor, NY: 2007. pp. 225–268.
    1. Huang H, Yoon H, Hannig EM, Donahue TF. GTP hydrolysis controls stringent selection of the AUG start codon during translation initiation in Saccharomyces cerevisiae. Genes Dev. 1997;11:2396–2413. - PMC - PubMed
    1. Algire MA, Maag D, Lorsch JR. Pi release from eIF2, not GTP hydrolysis, is the step controlled by start-site selection during eukaryotic translation initiation. Mol Cell. 2005;20:1–12. - PubMed
    1. Asano K, Clayton J, Shalev A, Hinnebusch AG. A multifactor complex of eukaryotic initiation factors eIF1, eIF2, eIF3, eIF5, and initiator tRNAMet is an important translation initiation intermediate in vivo. Genes Dev. 2000;14:2534–2546. - PMC - PubMed

Publication types

MeSH terms

LinkOut - more resources