. 2007 Jul 1;222(1):42-56.
doi: 10.1016/j.taap.2007.03.032. Epub 2007 Apr 21.

Gene expression profiling and differentiation assessment in primary human hepatocyte cultures, established hepatoma cell lines, and human liver tissues

Affiliations

Gene expression profiling and differentiation assessment in primary human hepatocyte cultures, established hepatoma cell lines, and human liver tissues

Katy M Olsavsky et al. Toxicol Appl Pharmacol. .

Abstract

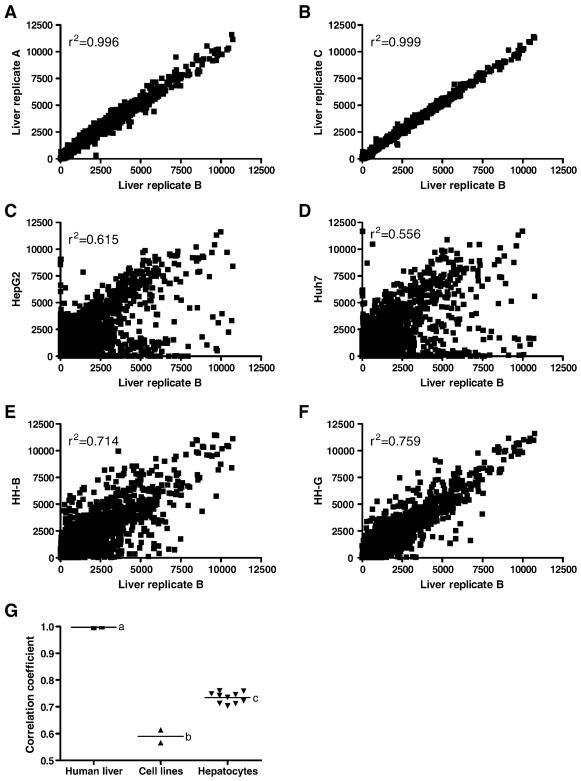
Frequently, primary hepatocytes are used as an in vitro model for the liver in vivo. However, the culture conditions reported vary considerably, with associated variability in performance. In this study, we characterized the differentiation character of primary human hepatocytes cultured using a highly defined, serum-free two-dimensional sandwich system, one that configures hepatocytes with collagen I as the substratum together with a dilute extracellular matrix (Matrigeltrade mark) overlay combined with a defined serum-free medium containing nanomolar levels of dexamethasone. Gap junctional communication, indicated by immunochemical detection of connexin 32 protein, was markedly enhanced in hepatocytes cultured in the Matrigel sandwich configuration. Whole genome expression profiling enabled direct comparison of liver tissues to hepatocytes and to the hepatoma-derived cell lines, HepG2 and Huh7. PANTHER database analyses were used to identify biological processes that were comparatively over-represented among probe sets expressed in the in vitro systems. The robustness of the primary hepatocyte cultures was reflected by the extent of unchanged expression character when compared directly to liver, with more than 77% of the probe sets unchanged in each of the over-represented categories, representing such genes as C/EBPalpha, HNF4alpha, CYP2D6, and ABCB1. In contrast, HepG2 and Huh7 cells were unchanged from the liver tissues for fewer than 48% and 55% of these probe sets, respectively. Further, hierarchical clustering of the hepatocytes, but not the cell lines, shifted from donor-specific to treatment-specific when the probe sets were filtered to focus on phenobarbital-inducible genes, indicative of the highly differentiated nature of the hepatocytes when cultured in a highly defined two-dimensional sandwich system.


Figures

Figure 1
Figure 1
Detection of connexin 32 using immunohistochemistry in primary human hepatocytes maintained in monolayer and sandwich culture. Hepatocytes were cultured on collagen-coated flasks and were either maintained as a monolayer (A and B) or overlaid with a dilute layer of Matrigel (C and D). After fixation, cells were subjected to immunohistochemical analysis for connexin 32 using an Alexa Fluor secondary antibody conjugated with a FITC molecule. Images were taken as bright field (A and C) or with a FITC-specific filter (B and D). Magnification ×200.
Figure 2
Figure 2
Albumin (ALB), a differentiation marker, and α-fetoprotein (AFP), a dedifferentiation marker, estimate the differentiation status of the in vitro hepatic models. Data are expressed as fold change (A and C). These markers were verified by QRT-PCR, using the ΔΔCt method for analysis where 18S is the reference gene and the human liver is the reference sample. Data are expressed as fold change, defined by 2−ΔΔCt (B and D). Differential expression is defined as greater than four-fold change from the human liver (dotted lines).
Figure 3
Figure 3
Correlation of gene expression profiles between human liver and either technical replicates, hepatoma-derived cell lines, or primary human hepatocytes. Scatter plots are shown for correlation of a representative liver pool (Liver replicate B) to: two technical replicates, Liver replicates A (A) and C (B); HepG2 cells (C); Huh7 cells (D); two human hepatocyte donors, HH-B (E) and HH-G (F). G summarizes the mean correlation of the individual HepG2, Huh7, and human hepatocytes arrays to the human liver pools and the correlation of technical replicates to a representative array of pooled human liver (liver replicate B). Different letters (a, b, c) indicate significantly different correlation of that group to the human liver pool (p<0.001; one-way ANOVA with Tukey’s multiple comparison post-test).
Figure 4
Figure 4
Regulation of the individual probe sets in overrepresented GO categories in the in vitro hepatic models. For each array, the probe sets in each GO category with a detection call of Present were scored as either ‘not changed’ (−2 < signal log ratio < 2), ‘increased’ (signal log ratio > 2), or ‘decreased’ (signal log ratio < −2). Data for the human hepatocytes are expressed as mean ± SD, summarizing results from 10 human hepatocyte donors. Data for the hepatoma-derived cell lines are expressed as results from a single array. The list for ‘Oxidoreductase’ (A) contains 270 probe sets (186 genes); ‘Transferase’ (B) contains 329 probe sets (221 genes); ‘Lipid, fatty acid, and steroid metabolism’ (C) contains 339 probe sets (239 genes); ‘Detoxification’ (D) contains 35 probe sets (29 genes); ‘Signaling molecule’ (E) contains 285 probe sets (207 genes); and ‘Phosphorylation’ (F) contains 230 probe sets (155 genes). Data in G and H are shown as individual results from the ten hepatocyte donors in two representative GO categories. * indicates that the ‘not changed’ regulation group has significantly more probe sets than the ‘increased’ or ‘decreased’ groups (p<0.001; one-way ANOVA with Tukey’s multiple comparison post-test).
Figure 5
Figure 5
Gene-level expression analysis of selected liver-specific categories in human hepatocyte donors and hepatoma-derived cell lines. Distribution of fold change from the liver in the ten hepatocyte donors are shown for genes encoding select transcription factors (A), drug metabolizing enzymes (C), and drug transporters (E). The fold change for the same genes in HepG2 cells and Huh7 cells are reported in B, D and F. Differential expression is defined as greater than four-fold change from the human liver (dotted lines). * indicates that the measured probe set is detected as absent in at least one human hepatocyte donor (PPARA: Absent in two donors; TCF1: two donors; CYP1A2: one donor; ABCB11: one donor; ABCC1: one donor). ** indicates that that probe set is detected as absent in Huh7 cells (NR1I2, NR1I3, CYP1A2, CYP2B6, CYP2C9, CYP2D6, CYP3A4, ABCB11, SLC22A1, SLC22A7). *** indicates that that probe set is detected as absent in HepG2 (CYP1A2, CYP2B6, CYP2C9, CYP2D6, CYP2E1, ABCB11, SLC22A1, SLC22A7, SLCO2B1).
Figure 6
Figure 6
Gene-level analysis of a complex biological response in human hepatocytes. Data are reported as linear signal intensity values for each untreated and PB-treated array for three target genes: CYP2B6 (A), CYP3A4 (B), and CYP2C9 (C). * indicates that the PB-treated signal intensity in a donor is more than four-fold increased from the untreated signal intensity. Data in D, E, and F are expressed as fold change from the human liver (p<0.01; paired t-test). Differential expression is defined as greater than four-fold change from the human liver (dotted lines). Induction of protein in response to PB treatment is shown for selected donors and hepatoma-derived cells lines (G).
Figure 7
Figure 7
Hierarchical clustering of the human liver replicates, hepatoma-derived cell lines, and human hepatocytes. Hierarchical clustering of the 27 arrays was performed using a dataset consisting of 39,485 probe sets (A), followed by clustering of both the 27 arrays and the PB-inducible probe sets, which were found to be both PB-responsive in at least 2 pairs of samples (untreated and PB-treated) and present in 13 or more of the arrays (B). A cluster of probe sets with a distinct expression pattern across the 27 arrays is magnified in C. All clustering was done using a Euclidean distance measure and an average linkage.

Similar articles

Cited by

References

    1. Annaert PP, Brouwer KL. Assessment of drug interactions in hepatobiliary transport using rhodamine 123 in sandwich-cultured rat hepatocytes. Drug Metab Dispos. 2005;33:388–394. - PubMed
    1. Assem M, Schuetz EG, Leggas M, Sun D, Yasuda K, Reid G, Zelcer N, Adachi M, Strom S, Evans RM, Moore DD, Borst P, Schuetz JD. Interactions between hepatic Mrp4 and Sult2a as revealed by the constitutive androstane receptor and Mrp4 knockout mice. J Biol Chem. 2004;279:22250–22257. - PubMed
    1. Baldi P, Long AD. A Bayesian framework for the analysis of microarray expression data: regularized t -test and statistical inferences of gene changes. Bioinformatics. 2001;17:509–519. - PubMed
    1. Ben Ze’ev A, Robinson GS, Bucher NL, Farmer SR. Cell-cell and cell-matrix interactions differentially regulate the expression of hepatic and cytoskeletal genes in primary cultures of rat hepatocytes. Proc Natl Acad Sci USA. 1988;85:2161–2165. - PMC - PubMed
    1. Boess F, Kamber M, Romer S, Gasser R, Muller D, Albertini S, Suter L. Gene expression in two hepatic cell lines, cultured primary hepatocytes, and liver slices compared to the in vivo liver gene expression in rats: possible implications for toxicogenomics use of in vitro systems. Toxicol Sci. 2003;73:386–402. - PubMed

Publication types

MeSH terms