

Sexual dimorphism of brain developmental trajectories during childhood and adolescence
- PMID: 17513132
- PMCID: PMC2040300
- DOI: 10.1016/j.neuroimage.2007.03.053
Sexual dimorphism of brain developmental trajectories during childhood and adolescence
Abstract
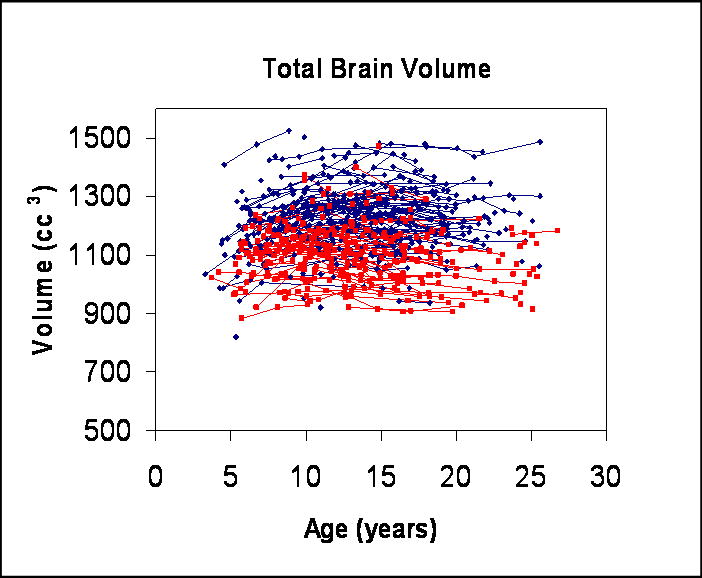
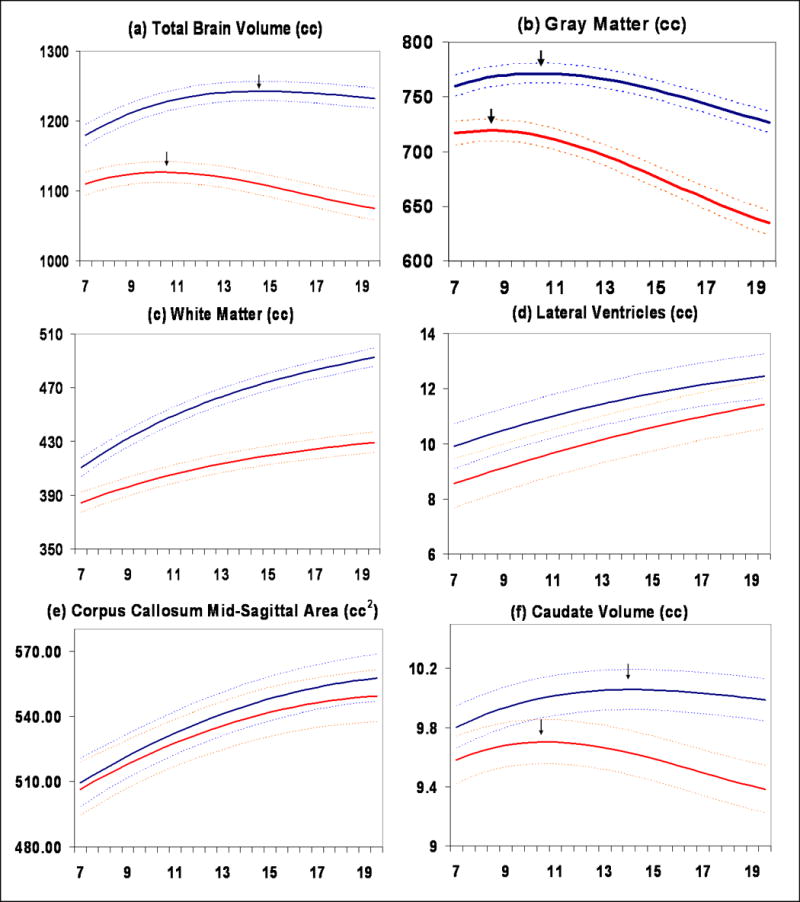
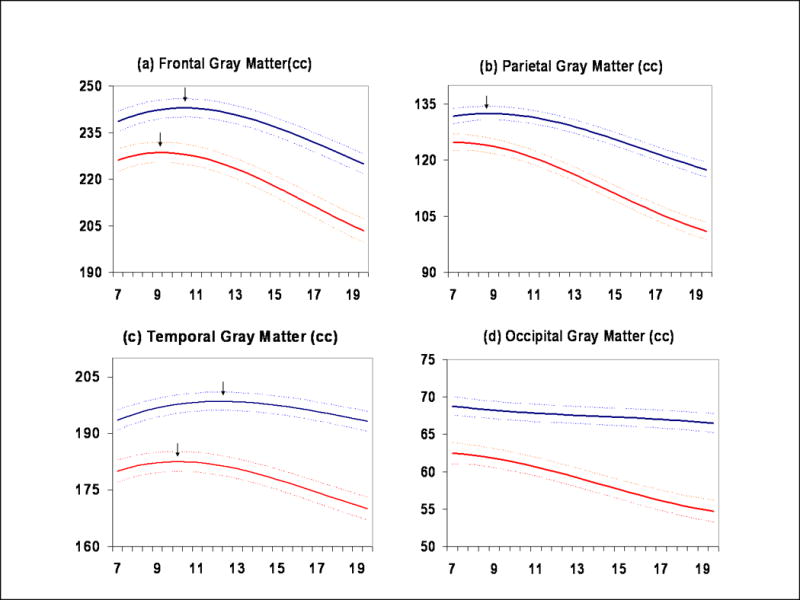
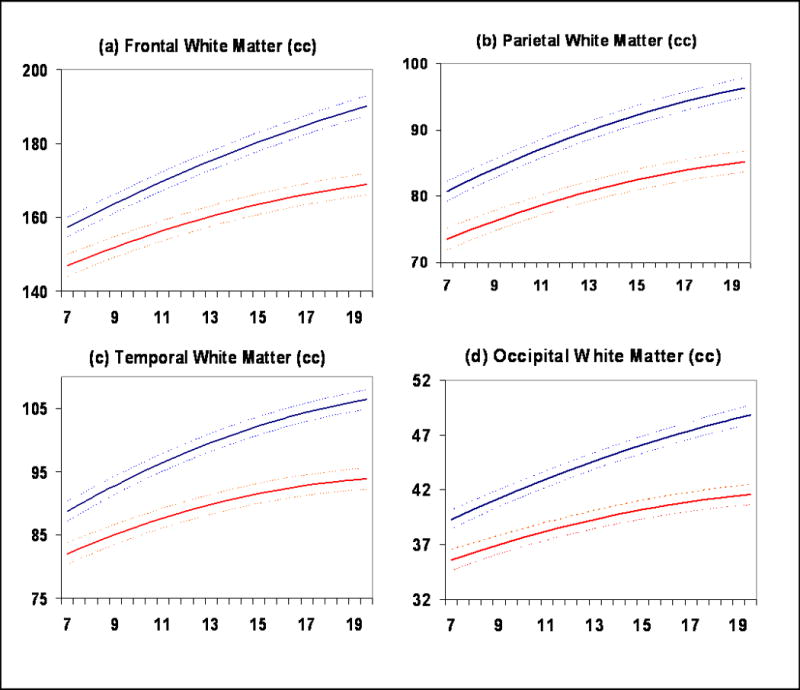
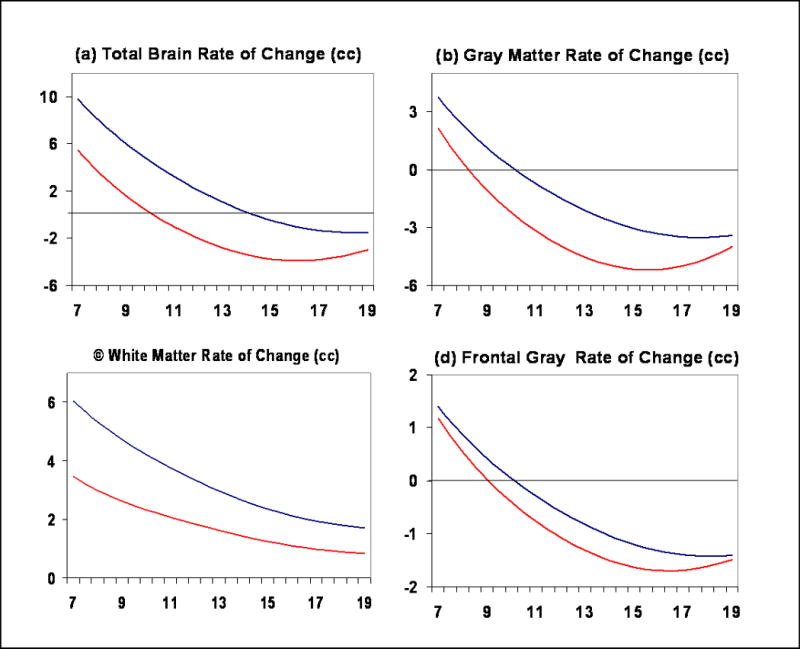
Human total brain size is consistently reported to be approximately 8-10% larger in males, although consensus on regionally specific differences is weak. Here, in the largest longitudinal pediatric neuroimaging study reported to date (829 scans from 387 subjects, ages 3 to 27 years), we demonstrate the importance of examining size-by-age trajectories of brain development rather than group averages across broad age ranges when assessing sexual dimorphism. Using magnetic resonance imaging (MRI) we found robust male/female differences in the shapes of trajectories with total cerebral volume peaking at age 10.5 in females and 14.5 in males. White matter increases throughout this 24-year period with males having a steeper rate of increase during adolescence. Both cortical and subcortical gray matter trajectories follow an inverted U shaped path with peak sizes 1 to 2 years earlier in females. These sexually dimorphic trajectories confirm the importance of longitudinal data in studies of brain development and underline the need to consider sex matching in studies of brain development.
Figures
References
-
- Achenbach TM, Edelbrock CS. Manual for child behavior checklist and revised behavior profile. Department of Psychiatry, University of Vermont; Burlington, VT: 1983.
-
- Benjamini Y, Hochberg Y. Controlling the false discovery rate: a practical and powerful approach to multiple testing. Journal of the Royal Statistical Society Series B. 1995:289–300.
-
- Cairns E, Malone S, Johnston J, Cammock T. Sex differences in children’s group embedded figures test performance. Person individ Diff. 1985;6:653–654.
-
- Cocosco CA, Zijdenbos AP, Evans AC. A fully automatic and robust brain MRI tissue classification method. Med Image Anal. 2003;7:513–527. - PubMed
-
- Collins DL, Holmes CJ, Peters TM, Evans AC. Automatic 3-D model-based neuroanatomical segmentation. Human Brain Mapping. 1995;3:190–208.
Publication types
MeSH terms
Grants and funding
LinkOut - more resources
Full Text Sources
Medical
