. 2007 Sep 15;93(6):2199-208.
doi: 10.1529/biophysj.107.108134. Epub 2007 May 18.

Nanometer-sized diamond particle as a probe for biolabeling

Affiliations

Nanometer-sized diamond particle as a probe for biolabeling

Jui-I Chao et al. Biophys J. .

Abstract

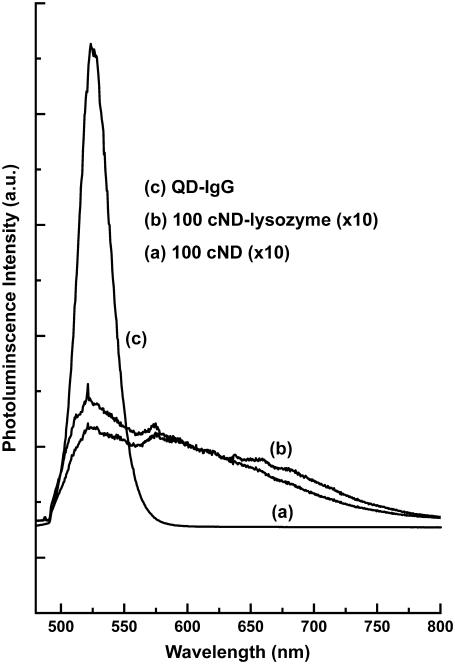
A novel method is proposed using nanometer-sized diamond particles as detection probes for biolabeling. The advantages of nanodiamond's unique properties were demonstrated in its biocompatibility, nontoxicity, easily detected Raman signal, and intrinsic fluorescence from its natural defects without complicated pretreatments. Carboxylated nanodiamond's (cND's) penetration ability, noncytotoxicity, and visualization of cND-cell interactions are demonstrated on A549 human lung epithelial cells. Protein-targeted cell interaction visualization was demonstrated with cND-lysozyme complex interaction with bacteria Escherichia coli. It is shown that the developed biomolecule-cND complex preserves the original functions of the test protein. The easily detected natural fluorescent and Raman intrinsic signals, penetration ability, and low cytotoxicity of cNDs render them promising agents in multiple medical applications.


Figures

FIGURE 1
FIGURE 1
Cytotoxicity test of cNDs on A549 human lung epithelial cell. (a) A typical view from conventional optical microscope for A549 cells treated with 1 mg/ml of 100-nm cND. (b) The cell survival rate as measured by MTT assay for both 5-nm cND and 100-nm cND–treated A549 cells.
FIGURE 2
FIGURE 2
Raman scanning on A549 human lung epithelial cell. (a) A typical scanning electron microscope image of 100-nm cND with the diamonds directly deposited on a single crystal silicon wafer. (b) Raman spectrum of 100-nm diamond. (c) Optical image of an A549 cell interacted with 100-nm cNDs. The sharp Raman signature in c can be used as an indicator to locate the diamond position in the cells. (d) The diamond Raman peak intensity distribution versus distance across the line indicated in c, scanning with a step of 0.5 μm.
FIGURE 3
FIGURE 3
Confocal Raman mapping of a single cND aggregation in A549 cell line. (a and b) Two A549 cells can be seen under optical microscope (water immersion objective, 65×) with cND concentration 10 μg/ml (a) and 1 μg/ml (b), respectively; (c and d) corresponding confocal Raman mapping locked on the diamond signals reveals the positions of the cND.
FIGURE 4
FIGURE 4
Comparison of the photoluminescence spectra of the QD and cND. The spectra are obtained using 488-nm wavelength laser excitation.
FIGURE 5
FIGURE 5
Confocal fluorescence images of an A549 cell and carboxylated 100 nm diamond. (a) The cell nuclei were dyed with Hoechst 33258 to reveal the position of the nucleus. (b) The cell tissue was dyed with anti-β-tubulin (Cy3) to reflect the cytoskeleton of the cells. (c) The cells were interacted with 100-nm cNDs and excited with 488-nm wavelength, and the emission was collected in the range of 500–530 nm. (d) Same as in c but exciting wavelength was 633 nm and emission was collected in the range 640–720 nm. (e) Merging the images of a–d.
FIGURE 6
FIGURE 6
Cross-sectional scan on a single A549 cell. (a) A series of confocal fluorescence images at changing position in the z direction from the top (upper left) down (bottom right) in one of the A549 cells in Fig. 3. When the confocal microscope is scanned in the vertical direction with steps 1 μm from top to bottom, the distribution of the anti-β-tubulin surrounding the nucleus can be clearly visible. (b) The fluorescence images reveal that diamond can penetrate into the cell and aggregate in cytoplasm. At this concentration of diamond (100 μg/ml), the cells survive the cytotoxicity test. The observed light signal from the 100-cNDs was excited with wavelength 488 nm, and the emission was collected in the range of 500–530 nm. (c) A phase-contrast image of the cell. (d) The merging of all three types of images.
FIGURE 7
FIGURE 7
Cross-sectional scan on a single A549 cell. A series of confocal fluorescence images at changing position in the z direction with 1-μm steps from the top (upper left) down (bottom right) in one of the A549 cells in Fig. 3. The position of a single (or aggregated) cND can be clearly visible (shown in green). At this concentration of diamond (1 μg/ml), the observed signal from the 100-cNDs was excited with wavelength 488 nm, and the emission was collected in the range of 500–530 nm.
FIGURE 8
FIGURE 8
Raman mapping of the cND-lysozyme interaction with E. coli. (a) Standardized number of E. coli colonies after 30 min of treatment with (I) PBS control; (II) lysozyme solution; (III) suspension of lysozyme-5cND conjugates, and (IV) suspension of lysozyme-100-cND conjugates. The measurements were obtained from eight independent experiments, and error bars were drawn using standard deviation. (b) The interaction of E. coli with cND-lysozyme complex as viewed with conventional optical microscope (objective 100×) and confocal Raman spectrometer. In the optical image, E. coli can be seen. The Raman signal of the diamond peak (1332 cm−1) was locked and scanned across a 10 μm × 10 μm area, and the distribution of diamond signal intensity was plotted. The location of the nanodiamond is indicated in yellow.

Similar articles

Cited by

References

    1. Poh, W. C., K. P. Loh, W. D. Zhang, S. Triparthy, J. S. Ye, and F. S. Sheu. 2004. Biosensing properties of diamond and carbon nanotubes. Langmuir. 20:5484–5492. - PubMed
    1. Carlise, J. A. 2004. Diamond films: Precious biosensors. Nat. Mater. 3:668–669. - PubMed
    1. Wang, J. 2005. Carbon-nanotube based electrochemical biosensors: a review. Electroanalysis. 17:7–14.
    1. Sotiropoulou, S., V. Gavalas, V. Vamvakaki, and N. A. Chaniotakis. 2003. Novel carbon materials in biosensor systems. Biosens. Bioelectron. 18:211–215. - PubMed
    1. Ushizawa, K., Y. Sato, T. Mitsumory, T. Machinami, T. Ueda, and T. Ando. 2002. Covalent immobilization of DNA on diamond and its verification by diffuse reflectance infrared spectroscopy. Chem. Phys. Lett. 351:105–108.

Publication types

LinkOut - more resources