. 2007 Aug 1;93(3):806-21.
doi: 10.1529/biophysj.107.107516. Epub 2007 May 18.

Mathematical and computational analysis of adaptation via feedback inhibition in signal transduction pathways

Affiliations

Mathematical and computational analysis of adaptation via feedback inhibition in signal transduction pathways

Marcelo Behar et al. Biophys J. .

Abstract

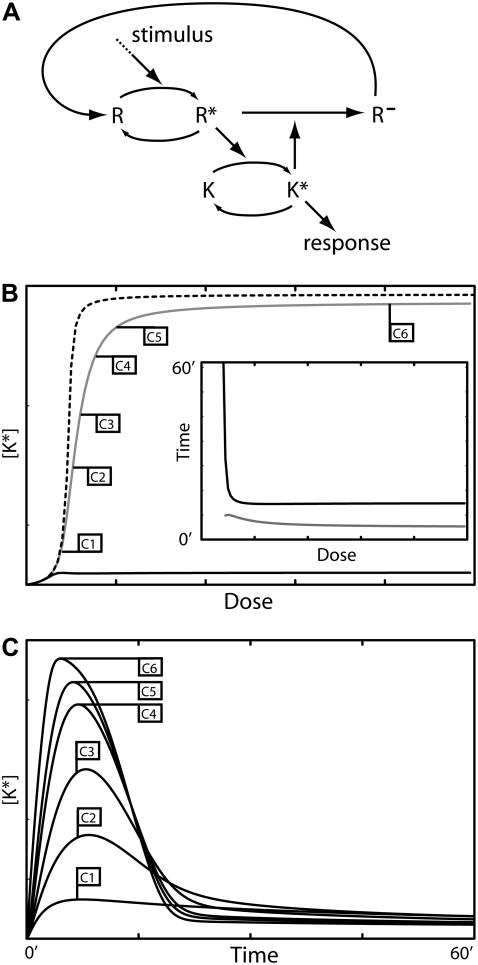
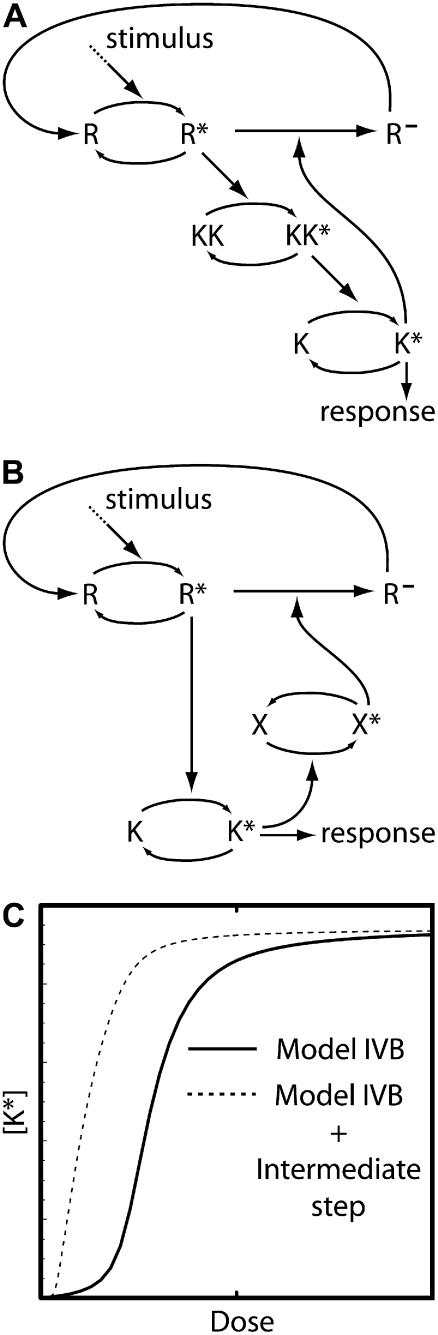
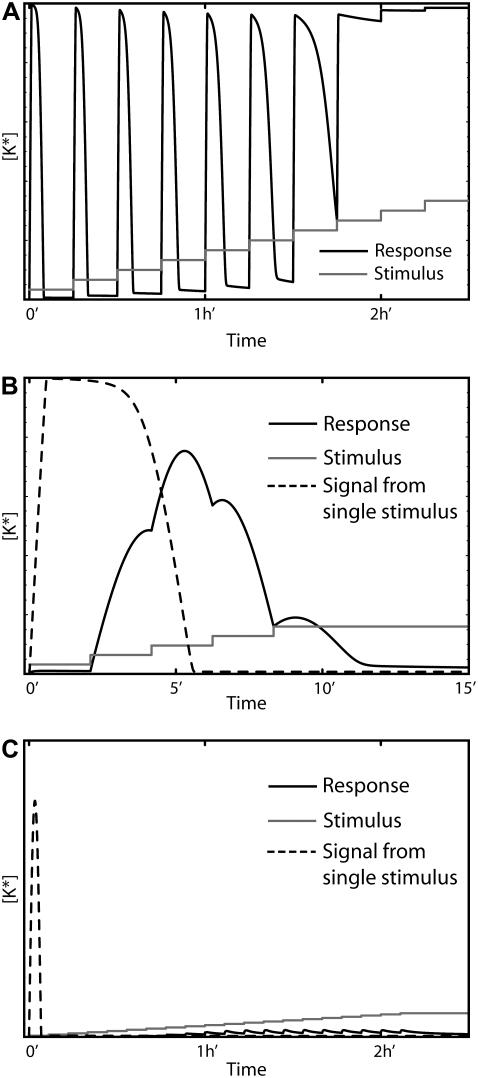
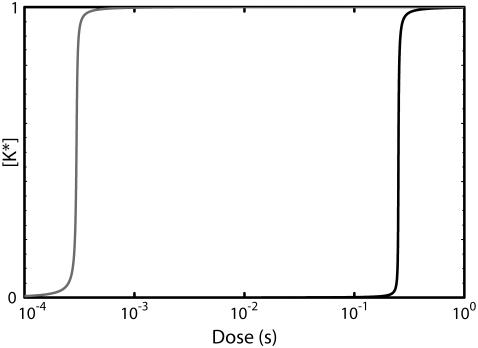
We perform a systematic analysis of mechanisms of feedback regulation that underlie short-term adaptation in intracellular signaling systems. Upon receiving an external cue, these systems generate a transient response that quickly returns to basal levels even if the stimulus persists. Signaling pathways capable of short-term adaptation are found in systems as diverse as the high osmolarity response of yeast, gradient sensing in Dictyostelium, and the cytokine response in vertebrates. Using mathematical analysis and computational experiments, we compare different feedback architectures in terms of response amplitude and duration, ability to adapt, and response to variable stimulus levels. Our analysis reveals three important features of these systems: 1), multiple step signaling cascades improve sensitivity to low doses by an effect distinct from signal amplification; 2), some feedback architectures act as signal transducers converting stimulus strength into response duration; and 3), feedback deactivation acts as a dose-dependent switch between transient and sustained responses. Finally, we present characteristic features for each form of feedback regulation that can aid in their identification.


Figures

FIGURE 1
FIGURE 1
Mechanisms for adaptation. (A) Integral control. (B) Feed-forward regulation. (C) Feedback inhibition through decreased activation (*) or increased deactivation (**).
FIGURE 2
FIGURE 2
Model I—feedback deactivation. (A) Schematic diagram of the model. (B) The phase plane of the system showing nullclines for [K*] and [P*]. (C) Response curves for K* as function of the stimulus dose: maximum [K*] amplitude with negative feedback (shaded curve) and without (dashed curve), and the steady-state level of [K*] with negative feedback (solid curve). (D) Response duration (solid curve) and time to maximum amplitude (shaded curve) as a function of the dose. The inset shows an amplification of the low dose regime. (E) Time series for [K*] generated using the stimulus levels indicated in panel D. The model equations and parameter values used to generate this figure are given in Appendices and Table 1.
FIGURE 3
FIGURE 3
Model II—direct feedback deactivation. (A) Schematic diagram of the model. (B) The phase plane of the system showing nullclines for [K*] and [KK*]. (C) Response curves for K* as function of the stimulus dose: maximum [K*] amplitude (shaded curve) and the steady-state level of K* (solid curve) (D) Time series for [K*] generated using the stimulus levels indicated in panel C. The model equations and parameter values used to generate this figure are given in Appendices and Table 1.
FIGURE 4
FIGURE 4
Intermediate pathway components. (A) Model III A is similar to Model I except that pathway deactivation occurs upstream of K. (B) Time series of K* generated by Model III A for various dose levels. (C) Model III B is similar to Model II except feedback deactivation occurs at an upstream pathway component. (D) Response curves for K* as function of the stimulus dose for Model III B: maximum [K*] amplitude (shaded curve) and the steady-state level of K* (solid curve). (E) Time series for [K*] generated using the stimulus levels indicated in panel D. The inset shows time series of the upstream species KK* and KKK* illustrating the delay effect discussed in the text. The model equations and parameter values used to generate this figure are given in Appendices and Table 1.
FIGURE 5
FIGURE 5
Model IV A—feedback degradation. (A) Schematic diagram of the model. (B) The [K*] versus [R*] dose-response curve. The vertical dotted line indicates the threshold for K* activation. (C) Response curves for R* and R as function of the stimulus dose: maximum [R*] amplitude with negative feedback (shaded curve) and without (dashed curve), steady-state level of R* with negative feedback (solid curve). The dotted shaded line indicates the R* threshold for K activation. (D) Dose response curves for K*: maximum amplitude with feedback (shaded curve) and without (dashed curve) and the steady-state level with feedback (solid curve). The inset shows the response duration (solid curve) and time to maximum amplitude (shaded line). No signal is generated at very low doses due to the activation threshold (see text). (E) Time series for [K*] and [R*] (inset, dotted line indicates the activation threshold) generated using the stimulus levels indicated in panel D. The model equations and parameter values used to generate this figure are given in Appendices and Table 1.
FIGURE 6
FIGURE 6
Model IV B—feedback desensitization. (A) Schematic diagram of the model. (B) Dose response curves for K*: maximum amplitude with negative feedback (shaded curve) and without (dashed curve) and the steady-state level with negative feedback (solid curve). (Inset) Signal duration (solid curve) and time to maximum amplitude (shaded curve). (C) Time series for [K*] using the stimulus levels indicated in panel B. The model equations and parameter values used to generate this figure are given in Appendices and Table 1.
FIGURE 7
FIGURE 7
Intermediate pathway components. (A) An intermediate step between stimulus activation of R and the response element K. (B) An intermediate step in the negative feedback loop. (C) Maximum response amplitude for Model IV B (solid curve) and the model shown in panel A (dashed curve).
FIGURE 8
FIGURE 8
The response of Model I (feedback deactivation) to stepped increases in the stimulus. (A) When the steps in stimulus level (shaded curve) are sufficiently long and of sufficient amplitude, the model responds with a series of pulses (solid curve) of roughly equal amplitude until adaptation is lost. (B) If the duration of the stimulus steps is short (shaded curve), a complex response is generated (solid curve) whose maximum amplitude is less than the response produced by exposure to constant stimulus at the final concentration level (dashed curve). (C) If the amplitude of the stimulus increases is too small, the system cannot see the stimulus and does not respond (solid curve). For comparison, the response produced by a constant stimulus of at the final concentration level is also shown (dashed curve).
FIGURE 9
FIGURE 9
(A) A transient to sustained switch. An adapting pathway based on saturable negative feedback (e.g., Model I) can produce transient or sustained signals in a dose-dependent fashion. Transient or sustained activation of a kinase (or transcription factor) results in the activation of a different subset of genes, thereby eliciting alternative responses. (B) The ability of this architecture to encode stimulus concentration as signal duration provides a mechanism for preventing cross-talk. The response on the left (RL) is initiated only when MAPK activation is sustained, whereas activation of the response on the right (RR) requires the MAPK activation to transiently exceed a threshold. The upstream adaptive system of the right pathway prevents inappropriate activation of RL by stimulus SR and regulates response LR by transforming the concentration of the stimulus SL into signal duration.
FIGURE 10
FIGURE 10
The [P*] vs. [K*] response curve for Model I.
FIGURE 11
FIGURE 11
The [K*] response curve as a function of stimulus strength (s) for Model I in the absence of P* (shaded curve), and maximum P* (solid curve). Intermediate P* levels will shift the shaded curve to the right and turn off the signal.

References

    1. Kholodenko, B. N. 2006. Cell-signaling dynamics in time and space. Nat. Rev. Mol. Cell Biol. 7:165–176. - PMC - PubMed
    1. Marshall, C. J. 1995. Specificity of receptor tyrosine kinase signaling: transient versus sustained extracellular signal-regulated kinase activation. Cell. 80:179–185. - PubMed
    1. Sabbagh, W., Jr., L. J. Flatauer, A. J. Bardwell, and L. Bardwell. 2001. Specificity of MAP kinase signaling in yeast differentiation involves transient versus sustained MAPK activation. Mol. Cell. 8:683–691. - PMC - PubMed
    1. Wormald, S., J. G. Zhang, D. L. Krebs, L. A. Mielke, J. Silver, W. S. Alexander, T. P. Speed, N. A. Nicola, and D. J. Hilton. 2006. The comparative roles of suppressor of cytokine signaling-1 and -3 in the inhibition and desensitization of cytokine signaling. J. Biol. Chem. 281:11135–11143. - PubMed
    1. Hao, N., M. Behar, S. C. Parnell, M. P. Torres, C. H. Borchers, T. C. Elston, and H. G. Dohlman. 2007. A systems-biology analysis of feedback inhibition in the Sho1 osmotic-stress-response pathway. Curr. Biol. 17:659–667. - PubMed

Substances

LinkOut - more resources