

Chlorophyll ring deformation modulates Qy electronic energy in chlorophyll-protein complexes and generates spectral forms
- PMID: 17513370
- PMCID: PMC1959541
- DOI: 10.1529/biophysj.107.104554
Chlorophyll ring deformation modulates Qy electronic energy in chlorophyll-protein complexes and generates spectral forms
Abstract
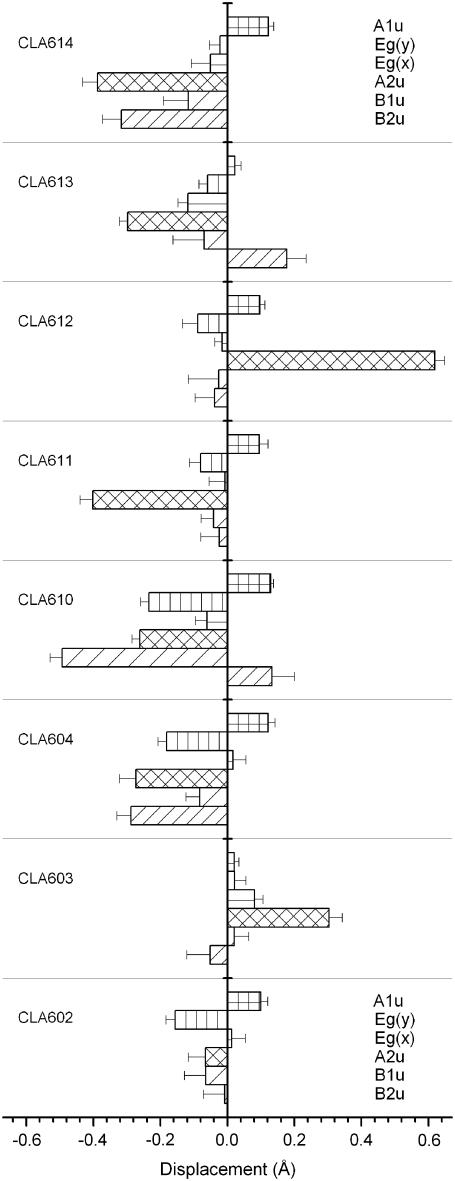
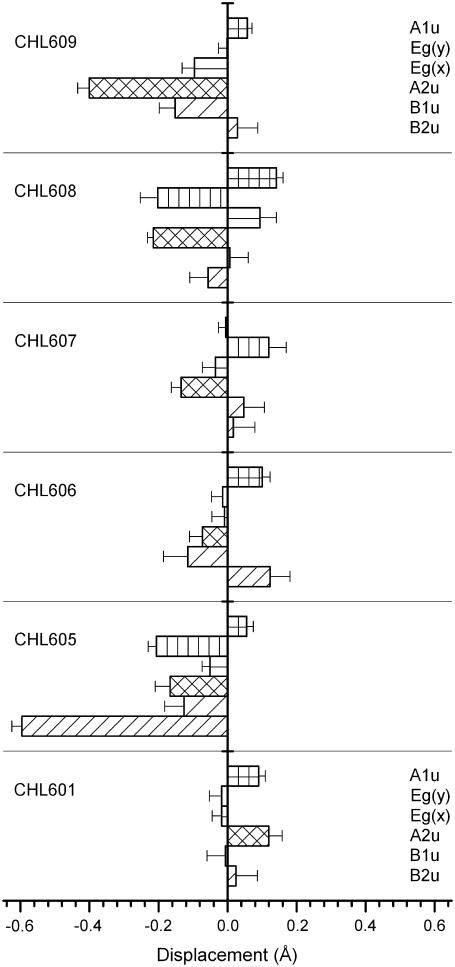
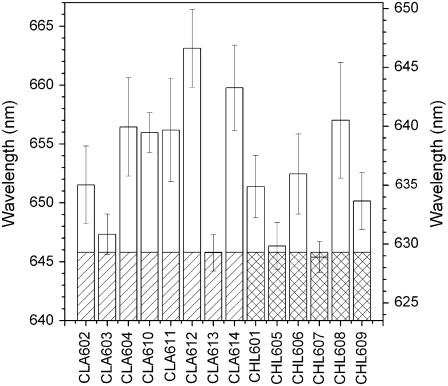
The possibility that the chlorophyll (chl) ring distortions observed in the crystal structures of chl-protein complexes are involved in the transition energy modulation, giving rise to the spectral forms, is investigated. The out-of-plane chl-macrocycle distortions are described using an orthonormal set of deformations, defined by the displacements along the six lowest-frequency, out-of-plane normal coordinates. The total chl-ring deformation is the linear combination of these six deformations. The two higher occupied and the two lower unoccupied chl molecular orbitals, which define the Q(y) electronic transition, have the same symmetry as four of the six out-of-plane lowest frequency modes. We assume that a deformation along the normal-coordinate having the same symmetry as a given molecular orbital will perturb that orbital and modify its energy. The changes in the chl Q(y) transition energies are evaluated in the Peridinin-Chl-Protein complex and in light harvesting complex II (LHCII), using crystallographic data. The macrocycle deformations induce a distribution of the chl Q(y) electronic energy transitions which, for LHCII, is broader for chla than for chlb. This provides the physical mechanism to explain the long-held view that the chla spectral forms in LHCII are both more numerous and cover a wider energy range than those of chlb.
Figures


Similar articles
-
The Q(y) absorption spectrum of the light-harvesting complex II as determined by structure-based analysis of chlorophyll macrocycle deformations.Biochemistry. 2012 Apr 3;51(13):2717-36. doi: 10.1021/bi201677q. Epub 2012 Mar 23. Biochemistry. 2012. PMID: 22417459
-
Carotenoid-to-chlorophyll energy transfer in recombinant major light-harvesting complex (LHCII) of higher plants. I. Femtosecond transient absorption measurements.Biophys J. 2001 Feb;80(2):901-15. doi: 10.1016/S0006-3495(01)76069-9. Biophys J. 2001. PMID: 11159457 Free PMC article.
-
Monitoring fluorescence of individual chromophores in peridinin-chlorophyll-protein complex using single molecule spectroscopy.Biochim Biophys Acta. 2007 Jul;1767(7):956-64. doi: 10.1016/j.bbabio.2007.05.004. Epub 2007 May 18. Biochim Biophys Acta. 2007. PMID: 17572378
-
Spectroscopy of the peridinin-chlorophyll-a protein: insight into light-harvesting strategy of marine algae.Arch Biochem Biophys. 2007 Feb 15;458(2):111-20. doi: 10.1016/j.abb.2006.10.006. Epub 2006 Oct 27. Arch Biochem Biophys. 2007. PMID: 17098207 Review.
-
The unique photophysical properties of the Peridinin-Chlorophyll-α-Protein.Curr Protein Pept Sci. 2014;15(4):332-50. doi: 10.2174/1389203715666140327111139. Curr Protein Pept Sci. 2014. PMID: 24678668 Free PMC article. Review.
Cited by
-
Structural Determinants of Redox Conduction Favor Robustness over Tunability in Microbial Cytochrome Nanowires.bioRxiv [Preprint]. 2023 Jan 22:2023.01.21.525004. doi: 10.1101/2023.01.21.525004. bioRxiv. 2023. Update in: J Phys Chem B. 2023 Aug 17;127(32):7148-7161. doi: 10.1021/acs.jpcb.3c02912. PMID: 36712098 Free PMC article. Updated. Preprint.
-
Accurate Computation of the Absorption Spectrum of Chlorophyll a with Pair Natural Orbital Coupled Cluster Methods.J Phys Chem B. 2020 Oct 8;124(40):8761-8771. doi: 10.1021/acs.jpcb.0c05761. Epub 2020 Sep 25. J Phys Chem B. 2020. PMID: 32930590 Free PMC article.
-
Shedding Light on Primary Donors in Photosynthetic Reaction Centers.Front Microbiol. 2021 Oct 1;12:735666. doi: 10.3389/fmicb.2021.735666. eCollection 2021. Front Microbiol. 2021. PMID: 34659164 Free PMC article. Review.
-
Robust light harvesting by a noisy antenna.Phys Chem Chem Phys. 2018 Feb 7;20(6):4360-4372. doi: 10.1039/c7cp06139k. Phys Chem Chem Phys. 2018. PMID: 29368769 Free PMC article.
-
The Ability of Chlorophyll to Trap Carcinogen Aflatoxin B1: A Theoretical Approach.Int J Mol Sci. 2022 May 28;23(11):6068. doi: 10.3390/ijms23116068. Int J Mol Sci. 2022. PMID: 35682746 Free PMC article.
References
-
- Shipman, L. L., T. M. Cotton, J. R. Norris, and J. J. Katz. 1976. An analysis of the visible absorption spectrum of chlorophyll a monomer, dimer, and oligomers in solution. J. Am. Chem. Soc. 98:8222–8230. - PubMed
-
- Fujiwara, M., and M. Tasumi. 1986. Resonance Raman and infrared studies on axial coordination to chlorophyll a and b in vitro. J. Phys. Chem. 90:250–255.
-
- Fujiwara, M., and M. Tasumi. 1986. Metal-sensitive bands in the Raman and infrared spectra of intact and metal-substituted chlorophyll a. J. Phys. Chem. 90:5646–5650.
-
- Fujiwara, M., H. Hayashiand, and M. Tasumi. 1988. Low-frequency vibrational spectra of chlorophyll a and b in solution: effects of axial coordination. Croat. Chem. Acta. 61:435–446.
-
- Krawczyk, S. 1989. The effects of hydrogen bonding and coordination interaction in visible absorption and vibrational spectra of chlorophyll a. Biochim. Biophys. Acta. 976:140–149.
MeSH terms
Substances
LinkOut - more resources
Full Text Sources
