Review
. 2007 Jun;137(6 Suppl 1):1549S-1555S; discussion 1573S-1575S.
doi: 10.1093/jn/137.6.1549S.

An overview of phenylalanine and tyrosine kinetics in humans

Affiliations
Review

An overview of phenylalanine and tyrosine kinetics in humans

Dwight E Matthews. J Nutr. 2007 Jun.

Abstract

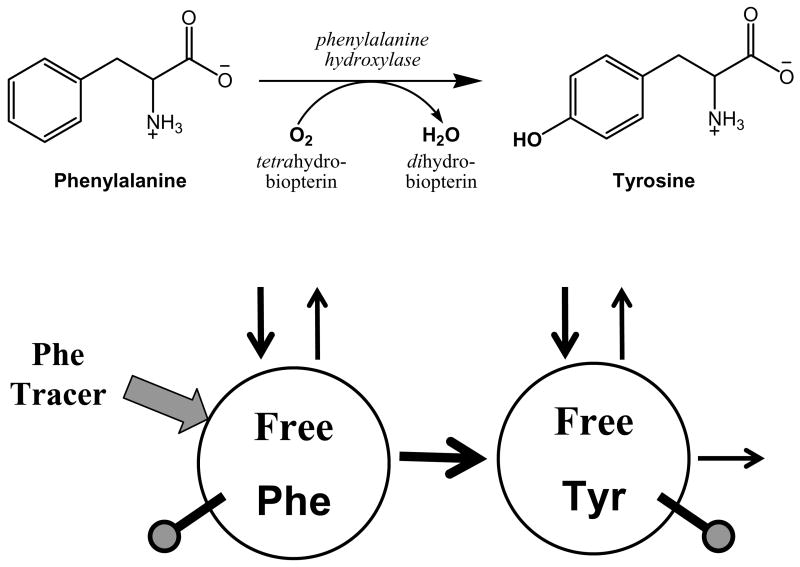
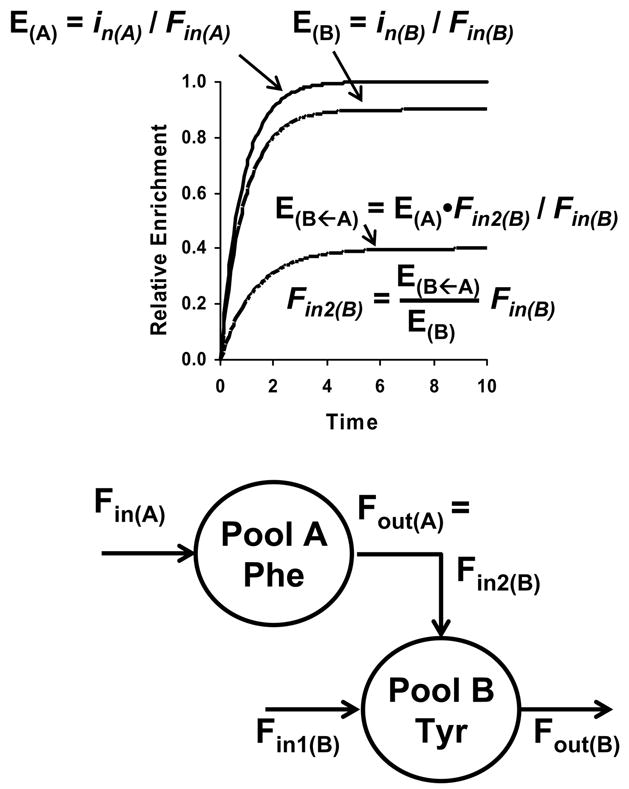
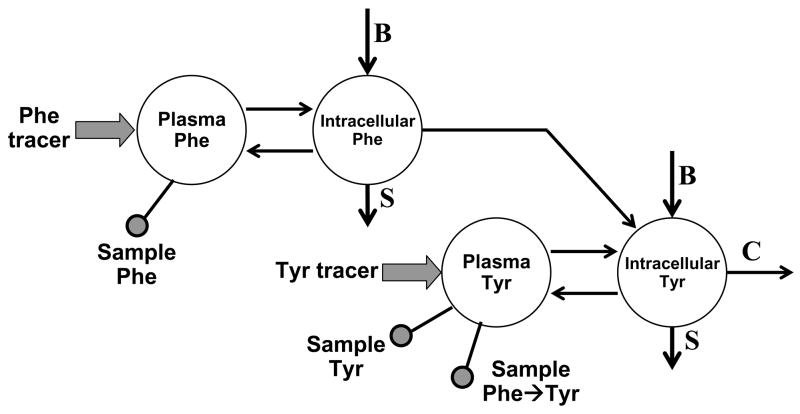
The initial use of a tracer of phenylalanine was by Moss and Schoenheimer in rats in 1940 to determine that phenylalanine was hydroxylated to tyrosine, defining for the first time the primacy of this pathway. Phenylalanine and tyrosine kinetics were not measured in humans until the 1970-80s. The first application was to determine the degree of blockage of phenylalanine hydroxylation in patients with hyperphenylalanemia and phenylketonuria, but this approach was expanded to determination of phenylalanine hydroxylation in normal subjects. Far more uses have been demonstrated for measuring rates of phenylalanine disposal and tyrosine production in relatively normal subjects than in patients with in-born errors of metabolism. Key to use of tracers to determine phenylalanine and tyrosine metabolic rates has been the development of appropriate tracer models. Most applications have used relatively simple models ignoring the intracellular hydroxylation rate component. Because the liver is the primary site of hydroxylation in the body, the intracellular enrichment at the site of hydroxylation can be assessed from the tracer enrichments at isotopic steady state in rapid-turnover plasma proteins, such as Apo-B, made and secreted by the liver. Although there are potential problems with use of deuterated tracers of phenylalanine, suitable tracers are available and have been demonstrated for general measurement of phenylalanine and tyrosine kinetics in humans.


Figures

FIGURE 1
FIGURE 1
Model to measure conversion of phenylalanine to tyrosine using a phenylalanine tracer. The top half shows the reaction converting phenylalanine to tyrosine via phenylalanine hydroxylase. The bottom half shows the model equivalent. Circles denote the free phenylalanine (Phe) and tyrosine (Tyr) pools. Arrows indicate rates of appearance and disappearance from the free pools due to whole body protein synthesis and breakdown. The wide arrow indicates administration of a phenylalanine tracer (usually by continuous infusion) into the free phenylalanine pool. Tracer abundance (enrichment) is measured in free phenylalanine and in tyrosine (indicated by the ball and stick figure to denote sampling from the free pools). The ratio of the tyrosine tracer enrichment divided by the phenylalanine tracer enrichment defines the fraction of free tyrosine derived from phenylalanine.
FIGURE 2
FIGURE 2
Two pool model of phenylalanine-tyrosine metabolism and tracer enrichments shown during continuous infusion of phenylalanine and tyrosine tracers. Theoretical time courses of the tracer enrichments for phenylalanine (E(A)), tyrosine (E(B)) and the phenylalanine tracer in tyrosine (E(B←A)) are shown in the upper half of the figure. The model is shown in the bottom half where the pools are for free phenylalanine (pool A) and tyrosine (pool B). Inputs into pool A (Fin(A)) and pool B (Fin(B)) are from phenylalanine and tyrosine release from protein breakdown. Phenylalanine disposal (Fout(A)) is by conversion to tyrosine, and this rate equals the rate of tyrosine production from phenylalanine (Fin2(B)). Tyrosine is removed via tyrosine degradation (Fout(B)). Phenylalanine has one input; tyrosine has two with the total rate of input being Fin = Fin1(B) + Fin2(B). Because only the entry of unlabeled phenylalanine and tyrosine dilutes the tracers, rates of phenylalanine and tyrosine uptake for protein synthesis do not affect tracer enrichments and are not shown in the model. The phenylalanine tracer enrichment in blood (E(A)) at isotopic steady state during a continuous infusion of a phenylalanine tracer is the ratio of the rate of phenylalanine tracer infusion (in(A)) and rate of phenylalanine release from protein breakdown (Fin(A)). The rise of the phenylalanine enrichment to reach isotopic steady-state (“plateau”) is shown in the upper half of the figure and is the curve with the plateau enrichment of 1.0. Similarly a tyrosine tracer may be infused, and its enrichment (E(B)) will also be reflective of the rate of tyrosine infusion (in(B)) and rate of tyrosine appearance (Fin(B)). The enrichment of the phenylalanine tracer as tyrosine (E(B←A)) will also rise and reach a plateau during infusion of the phenylalanine tracer (shown as the enrichment curve with a plateau enrichment of 0.4). This enrichment can be used to calculate the rate of tyrosine production from phenylalanine (Fin2(B)).
FIGURE 3
FIGURE 3
Pathway of tyrosine degradation. After the first step of transamination of tyrosine with α-ketoglutarate (α-KG) to form glutamate and the ketoacid of tyrosine, the ketoacid is decarboxylated releasing the carboxyl-C as CO2. From there a series of steps opens up the aromatic ring, eventually forming fumarate and acetoacetate as end products.
FIGURE 4
FIGURE 4
A model showing the kinetic results reported by Cortiella et al. for six volunteers infused on one day with [1-13C]phenylalanine and [2,2-2H2]tyrosine on another day with [2,2-2H2]phenylalanine and [1-13C]tyrosine (12). Phenylalanine flux was determined from the dilution of the phenylalanine tracer in plasma and is represented by the bold arrow entering the free phenylalanine pool. Tyrosine flux was similarly determined from the dilution of the tyrosine tracer in plasma, but its flux is the sum of the two bold arrows entering the free tyrosine pool (tyrosine from protein breakdown and tyrosine from phenylalanine hydroxylation). The rate of phenylalanine hydroxylation was determined for each tracer pair from the phenylalanine tracer appearing as tyrosine as described in Fig. 2. The oxidation rates of phenylalanine and tyrosine were determined from the recovery of tracer as 13CO2 in exhaled air. All values are approximate because results from the two groups of infusions have been combined; all values are reported as μmol kg−1 h−1.
FIGURE 5
FIGURE 5
Model of whole body phenylalanine and tyrosine metabolism including intracellular pools. The model is similar to that shown in Fig. 2. The arrows are labeled with “B” for rate of phenylalanine or tyrosine entry into the intracellular phenylalanine and tyrosine pools from protein breakdown, “S” for rate of phenylalanine or tyrosine uptake from the intracellular pools for new protein synthesis, and “C” for rate of tyrosine oxidation. The model shows infusion inputs for a phenylalanine and a tyrosine tracer (wide arrows) and for sampling from plasma (ball and stick indicator) for phenylalanine tracer enrichment, tyrosine tracer enrichment, and phenylalanine tracer converted to tyrosine (Phe→Tyr).

Similar articles

Cited by

References

    1. Matthews DE. Proteins and amino acids. In: Shils ME, Shike M, Olson JA, Ross AC, Caballero B, Cousins RJ, editors. Modern Nutrition in Health and Disease. 10. Philadelphia: Lippincott, Williams & Wilkins; 2006. pp. 23–60.
    1. Moss AR, Schoenheimer R. The conversion of phenylalanine to tyrosine in normal rats. J Biol Chem. 1940 Sep 1;135:415–29.
    1. Womack M, Rose WC. Feeding experiments with mixtures of highly purified amino acids. VI. the relation of phenylalanine and tyrosine to growth. J Biol Chem. 1934 Nov 1;107:449–58.
    1. Grümer HD, Koblet H, Woodard C. Phenylalanine metabolism in the phenylpyruvic condition. II. An attempt to calculate the daily incorporation of phenylalanine into proteins. J Clin Invest. 1962;41:61–6. - PMC - PubMed
    1. O’Keefe SJD, Sender PM, James WPT. “Catabolic” loss of body nitrogen in response to surgery. Lancet. 1974;304:1035–43. - PubMed

Publication types