. 2007 May;19(5):1649-64.
doi: 10.1105/tpc.106.044891. Epub 2007 May 18.

The senescence-induced staygreen protein regulates chlorophyll degradation

Affiliations

The senescence-induced staygreen protein regulates chlorophyll degradation

So-Yon Park et al. Plant Cell. 2007 May.

Abstract

Loss of green color in leaves results from chlorophyll (Chl) degradation in chloroplasts, but little is known about how Chl catabolism is regulated throughout leaf development. Using the staygreen (sgr) mutant in rice (Oryza sativa), which maintains greenness during leaf senescence, we identified Sgr, a senescence-associated gene encoding a novel chloroplast protein. Transgenic rice overexpressing Sgr produces yellowish-brown leaves, and Arabidopsis thaliana pheophorbide a oxygenase-impaired mutants exhibiting a stay-green phenotype during dark-induced senescence have reduced expression of Sgr homologs, indicating that Sgr regulates Chl degradation at the transcriptional level. We show that the leaf stay-greenness of the sgr mutant is associated with a failure in the destabilization of the light-harvesting chlorophyll binding protein (LHCP) complexes of the thylakoid membranes, which is a prerequisite event for the degradation of Chls and LHCPs during senescence. Transient overexpression of Sgr in Nicotiana benthamiana and an in vivo pull-down assay show that Sgr interacts with LHCPII, indicating that the Sgr-LHCPII complexes are formed in the thylakoid membranes. Thus, we propose that in senescing leaves, Sgr regulates Chl degradation by inducing LHCPII disassembly through direct interaction, leading to the degradation of Chls and Chl-free LHCPII by catabolic enzymes and proteases, respectively.


Figures

Figure 1.
Figure 1.
Phenotypic Characterization of sgr during Natural and Dark-Induced Senescence. (A) Changes in leaf color of the wild type (left) and sgr (right) during the grain-filling period. Numbers indicate days after heading. The wild type was parental japonica cv Hwacheong-wx. Bar = 20 cm. (B) Color changes in attached leaves of the wild type (left) and sgr (right) during dark-induced senescence. Two-month-old rice plants grown in a paddy field were transferred to complete darkness at 25°C for 10 d. This experiment was performed more than three times with the same results. Numbers indicate DAD. Bars = 10 cm. (C) Leaf color phenotypes of excised plants of the wild type (left) and sgr (right) after dark incubation. One-month-old plants were excised, placed in moistened plastic bags, and incubated in complete darkness at 30°C for 8 d. This experiment was repeated more than three times with the same results. Bar = 10 cm. (D) Changes of Chl concentrations in leaves of the wild type and sgr during dark incubation. One-month-old (top panel) and 2-month-old (bottom panel) plants were excised and treated as described for (C). Chls were extracted from the leaf tissues. Mean and sd values were obtained from three replications. FW, fresh weight.
Figure 2.
Figure 2.
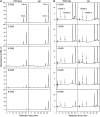
HPLC Results of Chls and Chl Catabolites in Senescing Leaves of the Wild Type and sgr. (A) HPLC results. Two-month-old plants were excised and incubated in complete darkness at 30°C for 8 d, and then Chl derivatives were extracted from leaf tissues for reverse-phase HPLC analysis. Chl a, Chl b, Chlide a, and Pheide a were determined at 660 nm with a photodiode array detector. The HPLC analysis was repeated three times with similar results. The wild type was parental japonica cv Hwacheong-wx. (B) Enlarged HPLC results from (A).
Figure 3.
Figure 3.
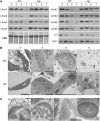
Immunoblot and Transmission Electron Microscopy Analyses of sgr. (A) Abundance of chloroplast thylakoid proteins in leaves of the wild type and sgr during dark-induced senescence. One-month-old plants were excised, placed in moistened plastic bags, and incubated in complete darkness at 30°C for 8 d. Each lane contained 5 μg of total protein from leaf tissue. LHCPI, LHCPII, D1, and cytochrome f (Cyt f) were detected by immunoblotting using their specific antibodies, and then the membrane was stained by Coomassie Brilliant Blue (CBB) after Lhca4 detection. The immunoblotting was repeated at least twice with similar results. Numbers indicate DAD. The wild type was parental japonica cv Hwacheong-wx. (B) Morphological changes in the chloroplasts of mesophyll cells in the wild type and sgr during dark-induced senescence. For each genotype, 20 1-month-old rice plants were used for transmission electron microscopy analysis. All green leaves were detached and incubated in complete darkness as described for (A). Two to three leaves were collected at each DAD, and four to five samples were prepared from each leaf. Finally, 10 to 12 samples at each DAD were prepared for transmission electron microscopy analysis. At least three well-cut sections of each sample were used to examine the chloroplast structures. We examined 10 cells in each section and photographed the chloroplast structures that were constantly present in >7 cells. Numbers indicate DAD. G, granum; N, nucleus; OG, osmiophilic plastoglobuli; S, starch granule; TM, thylakoid membrane. Bars = 1 μm. (C) Persistence of loose and unstacked thylakoid membranes in mesophyll cells of sgr at 8 DAD in (B). Bars = 0.2 μm.
Figure 4.
Figure 4.
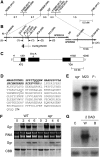
Map-Based Cloning and Characterization of Sgr. (A) Genetic mapping of sgr using RFLP and SSR markers on chromosome 9. (B) Physical mapping of sgr using PCR-based markers. Numbers in parentheses indicate the number of recombinant F2 individuals. (C) Schematic representation of Sgr structure and the sgr mutation position. White and black boxes represent untranslated regions and exons, respectively. Thin lines indicate introns. The predicted translation start (ATG) and stop (TGA) sites and the nucleotide transition from guanine (G) to adenine (A) in sgr are indicated. (D) Deduced amino acid sequence of Sgr. The chloroplast signal amino acids predicted by ChloroP and TargetP (Emanuelsson et al., 1999, 2000) are indicated in italicized boldface letters. A missense mutation (V99M) in sgr is underlined. (E) DNA gel blot analysis with Sgr cDNA probe. Genomic DNAs from the mapping parent Milyang23 (M23; wild type), sgr, and F1 hybrid were digested with EcoRI. (F) Abundance of Sgr mRNA and Sgr protein in leaves of the wild type and sgr during dark-induced senescence. One-month-old rice plants were excised, placed in moistened plastic bags, and incubated in complete darkness at 30°C for 6 d. Five micrograms of total RNA and 10 μg of total soluble protein from the leaves were loaded in each lane for RNA and protein gel blot analyses. The molecular masses of Sgr mRNA and Sgr protein are ∼1.6 kb and 22 kD, respectively. The radiolabeled Sgr cDNA and the affinity-purified anti-Sgr antibody were used for probes. Because there was no available Sgr-null mutant in rice, anti-Sgr antibody specificity was determined by the antigen blocking method (see Methods). Both preimmune serum and antigen-neutralized antibody were used to examine antibody specificity and revealed that no band was detected at 22 kD. This indicates that the affinity-purified anti-Sgr antibody is specific enough to detect native Sgr in total soluble protein fractions. Numbers indicate DAD. The wild type was parental japonica cv Hwacheong-wx. CBB, Coomassie Brilliant Blue. (G) Cytokinin effect on Sgr expression during dark-induced senescence. One-month-old wild-type (Hwacheong-wx) leaves were detached and floated on distilled water (W) or 100 μM 6-benzyladenine (B) as a cytokinin precursor and then incubated in complete darkness for 2 d. Five micrograms of total RNA was loaded in each lane. The abundance of Sgr transcripts (top panel) was shown based on the levels 18S rRNA (bottom panel). C indicates nontreated leaves as a negative control.
Figure 5.
Figure 5.
Overexpression of Sgr-GFP in the sgr Background. (A) Leaf colors of transgenic rice plants regenerated from the calli of sgr mutant embryos transformed with Pro35S:Sgr-GFP. Plant 1, nontransgenic wild-type plant (Hwacheong-wx); plants 2 to 4, transgenic plants exhibiting green (plant 2), mosaic (plant 3), and yellowish-brown (plant 4) phenotypes. Bar = 10 cm. (B) Abundance of the Sgr-GFP transcripts in (A) by semiquantitative RT-PCR. The presence of GFP transcripts indicates true transformants, and Osh69 expression was used as a senescence marker (see Supplemental Figure 3 and Supplemental Table 1 online). Actin1 (Act1) was used as a loading control. (C) Chl degradation in the chloroplasts of yellowish-brown leaves in (A) (plant 4). Dic, differential interference contrast. Bars = 10 μm. (D) A mature plant phenotype that survived from the transgenic mosaic seedlings in (A) (plant 3).
Figure 6.
Figure 6.
Expression Patterns of Sgr Homologs in Arabidopsis Wild Type and PaO-Impaired Mutants during Leaf Senescence. (A) Abundance of SGN1 (At4g22920) and SGN2 (At4g11910) mRNAs during dark-induced, detached leaf senescence in Arabidopsis. Arabidopsis (Columbia-0) plants were grown at constant 22°C under cool-white fluorescent light (100 μmol·m−2·s−1) in long days (16 h of light/8 h of dark) in the growth chamber. Rosette leaves (leaves 5 to 7) were detached at bolting, placed on Parafilm, and floated in distilled water on Petri plates. They were stored in complete darkness at 22°C. ELONGATION FACTOR1a (EF1a) was used as a loading control. Primer information for RT-PCR is listed in Supplemental Table 1 online. (B) SGN accumulation in Arabidopsis wild-type leaf 4 during natural senescence. Arabidopsis (Columbia-0) plants were grown under the same condition described for (A). Rosette leaf 4 was sampled every 4 d from 20 d after emergence (DAE) until it turned completely yellow. Anti-Sgr antibody was used for immunoblot analysis. Twenty micrograms of total soluble protein extracted from three leaves was loaded in each lane. (C) Stay-green leaf phenotypes of pao1 and acd1-20 at 6 DAD. Plants were grown under the same conditions described for (A) except that continuous light was used. Green rosette leaves (leaves 5 to 7) of 3-week-old plants were detached from each genotype, and dark treatment was the same as in (A). Leaf 7 of each genotype was photographed at 6 DAD. This analysis was performed at least three times with the same results. The wild type was Columbia-0. (D) Chl retention in pao1 and acd1-20 during dark-induced senescence. Leaf samples in (C) were used. Green rosette leaves (leaves 5 to 7) of 3-week-old plants were detached and placed in complete darkness as in (A). Mean and sd values were obtained from three replications. FW, fresh weight. (E) HPLC results of Chls and Chl catabolites in detached leaves of the wild type, pao1, and acd1-20 at 6 DAD. This analysis was performed three times with similar results. Peak 1, Chlide a; peak 2, Pheide a; peak 3, Chl b; peak 4, Chl a. (F) Reduced expression of SGN genes in pao1 and acd1-20 during dark-induced, detached leaf senescence. Five micrograms of total RNA extracted from three leaves (leaves 5 to 7) in (C) was loaded in each lane. Due to high sequence similarity between SGN1 and SGN2 cDNA sequences, the full-length SGN2 cDNA was used as a probe. Numbers indicate DAD. This analysis was performed twice with similar results. (G) No accumulation of SGN proteins in pao1 and acd1-20 during dark-induced, detached leaf senescence. Ten micrograms of total soluble RNA extracted from three leaves (leaves 5 to 7) in (C) was loaded in each lane. Anti-Sgr antibody was used for immunoblotting, and then the membrane was stained with Coomassie Brilliant Blue. This analysis was performed at least three times with the same results. RbcL, ribulose-1,5-bis-phosphate carboxylase/oxygenase large subunit.
Figure 7.
Figure 7.
Transient Overexpression of Sgr and sgr (V99M) in N. benthamiana. (A) Plant phenotypes of N. benthamiana infiltrated by recombinant agrobacteria containing Pro35S:Sgr (left plant; 1 to 3) or Pro35S:sgr (right plant; 4 to 6) in the pMBP-1 vector at 6 d after infiltration. Four of the 1-month-old plants were used for each infiltration and showed similar results. (B) Infiltrated leaf phenotypes of N. benthamiana in (A). Bar = 2 cm. (C) Changes in the abundance of LHCP subunits in infiltrated leaves of N. benthamiana from the accumulation of Sgr (leaf 1 in [B]) or sgr (V99M) (leaf 4 in [B]). Anti-Lhca1, anti-Lhcb1, and anti-Sgr antibodies were used for immunoblot analyses. The membrane was stained with Coomassie Brilliant Blue (CBB) after Lhca1 immunodetection. The molecular masses of Lhca1, Lhcb1, and Sgr are ∼22, 28, and 22 kD, respectively. Each lane represents the protein concentration of a 1-cm leaf disc (see Methods). This analysis was repeated twice with similar results. Numbers indicate days after infiltration. Day 0 indicates noninfiltrated leaf discs. OX, overexpression.
Figure 8.
Figure 8.
Sgr Interacts with LHCPII. (A) Sgr has specific affinity for LHCPI and LHCPII in vitro. Each sample was pulled down using amylose agarose resin (see Methods). LHCPI and LHCPII were detected by immunoblot using anti-Lhca4 and anti-Lhcb2 antibodies. The membrane was then stained with Coomassie Brilliant Blue (top panel). The total soluble protein fraction from green leaves of 1-month-old rice plants was used for the in vitro pull-down assay. The in vitro pull-down experiments were repeated three times with the same results. (B) Transient overexpression of Sgr-GST, GST, sgr (V99M)-GFP, and GFP in leaves of N. benthamiana. Pro35S:GST (lane 1) or Pro35S:Sgr-GST (lane 2) in the pMBP-1 vector, or Pro35S:GFP (lane 3) or Pro35S:sgr-GFP (lane 4) in the pCAMLA vector, was infiltrated into green leaves of 1-month-old N. benthamiana plants as in Figure 7. In vivo protein expression was verified with the infiltrated leaves at 4 d after infiltration by immunoblot using anti-GST (left panel) and anti-GFP (right panel) antibodies. (C) Sgr and sgr (V99M) interact with LHCPII in N. benthamiana. From the total soluble protein fractions extracted from the infiltrated leaves in (B), GST (lane 1) and Sgr-GST fusion (lane 2) were pulled down using glutathione Sepharose beads (left panel), and GFP (lane 3) and sgr (V99M)-GFP fusion (lane 4) were immunoprecipitated using anti-GFP antibody (right panel) (see Methods). LHCPII was detected by immunoblotting using anti-Lhcb1 antibody. LHCPI was not detected with any of the four anti-Lhca antibodies. The in vivo GST pull-down and GFP coimmunoprecipitation assays were performed at least twice with the same results.

Similar articles

Cited by

References

    1. Akhtar, M.S., Goldschmidt, E., John, I., Rodoni, S., Matile, P., and Grierson, D. (1999). Altered patterns of senescence and ripening in gf, a stay-green mutant of tomato (Lycopersicon esculentum Mill.). J. Exp. Bot. 50 1115–1122.
    1. Armstead, I., et al. (2006). From crop to model to crop: Identifying the genetic basis of the staygreen mutation in the Lolium/Festuca forage and amenity grasses. New Phytol. 172 592–597. - PubMed
    1. Armstead, I., et al. (2007). Cross-species identification of Mendel's I locus. Science 315 73. - PubMed
    1. Benedetti, C.E., and Arruda, P. (2002). Altering the expression of the chlorophyllase gene ATHCOR1 in transgenic Arabidopsis caused changes in the chlorophyll-to-chlorophyllide ratio. Plant Physiol. 128 1255–1263. - PMC - PubMed
    1. Benedetti, C.E., Costa, C.L., Turcinelli, S.R., and Arruda, P. (1998). Differential expression of a novel gene in response to coronatine, methyl jasmonate, and wounding in the Coi1 mutant of Arabidopsis. Plant Physiol. 116 1037–1042. - PMC - PubMed

Publication types

MeSH terms