. 2007 Aug;27(16):5806-18.
doi: 10.1128/MCB.02278-06. Epub 2007 May 21.

The intra-S-phase checkpoint affects both DNA replication initiation and elongation: single-cell and -DNA fiber analyses

Affiliations

The intra-S-phase checkpoint affects both DNA replication initiation and elongation: single-cell and -DNA fiber analyses

Jennifer A Seiler et al. Mol Cell Biol. 2007 Aug.

Abstract

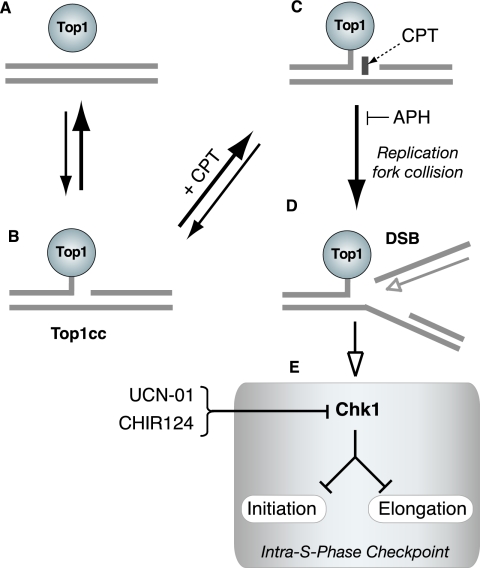
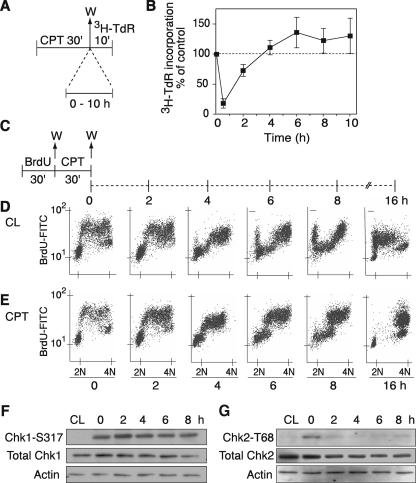
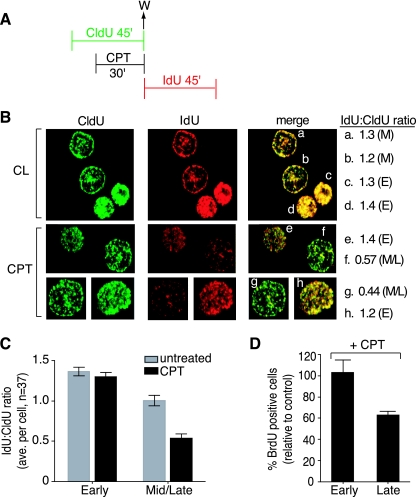
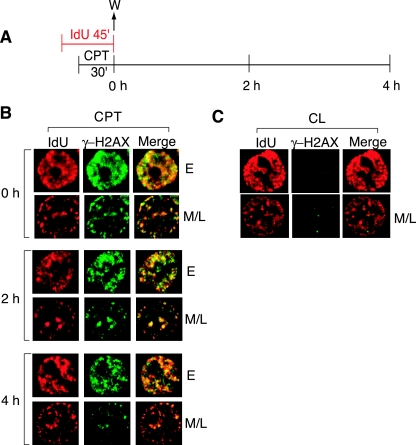
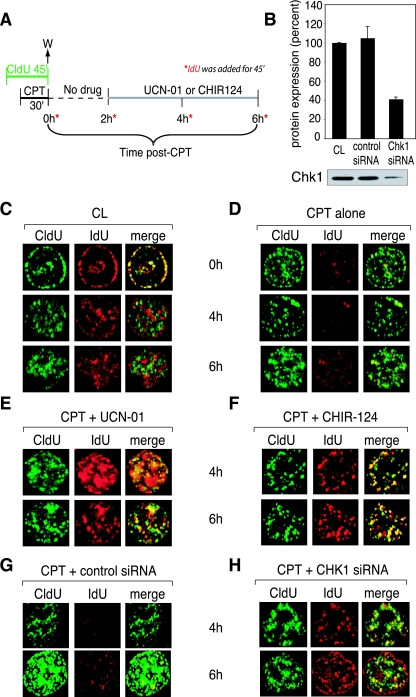
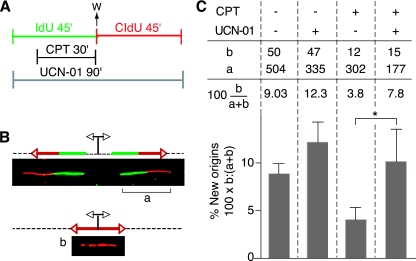
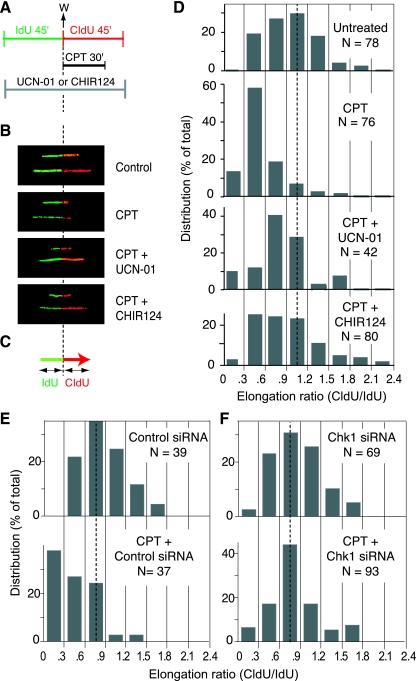
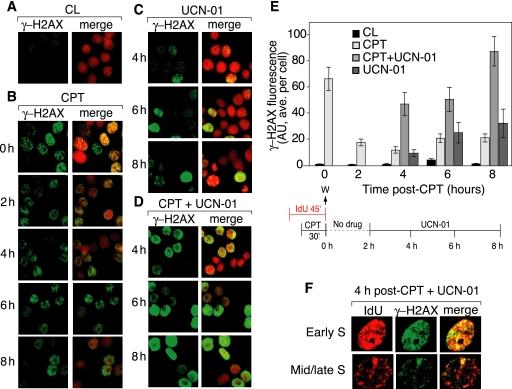
To investigate the contribution of DNA replication initiation and elongation to the intra-S-phase checkpoint, we examined cells treated with the specific topoisomerase I inhibitor camptothecin. Camptothecin is a potent anticancer agent producing well-characterized replication-mediated DNA double-strand breaks through the collision of replication forks with topoisomerase I cleavage complexes. After a short dose of camptothecin in human colon carcinoma HT29 cells, DNA replication was inhibited rapidly and did not recover for several hours following drug removal. That inhibition occurred preferentially in late-S-phase, compared to early-S-phase, cells and was due to both an inhibition of initiation and elongation, as determined by pulse-labeling nucleotide incorporation in replication foci and DNA fibers. DNA replication was actively inhibited by checkpoint activation since 7-hydroxystaurosporine (UCN-01), the specific Chk1 inhibitor CHIR-124, or transfection with small interfering RNA targeting Chk1 restored both initiation and elongation. Abrogation of the checkpoint markedly enhanced camptothecin-induced DNA damage at replication sites where histone gamma-H2AX colocalized with replication foci. Together, our study demonstrates that the intra-S-phase checkpoint is exerted by Chk1 not only upon replication initiation but also upon DNA elongation.


Figures

FIG. 1.
FIG. 1.
Proposed mechanism of replication-mediated DSB induction by CPT. (A) Under normal conditions, topoisomerase 1 (Top1) is noncovalently bound to chromatin. (B) Only a small fraction of Top1 creates transient DNA single-strand nicks (Top1cc), allowing unwinding of the DNA to relieve torsional stress. (C) CPT (rectangle) forms a complex with Top1cc, preventing religation of the single-strand break. (D) Replication of the leading strand (top strand) up to the 5′ end of the broken DNA produces a replication-mediated DSB (“replication runoff”). APH prevents the replication DSB by arresting DNA polymerase before it encounters a Top1cc. (E) Replication lesions activate Chk1, which activates the intra-S-phase checkpoint by arresting both DNA replication initiation and DNA elongation. UCN-01 and CHIR124 inhibit Chk1 activity and abrogate the cell cycle checkpoint.
FIG. 2.
FIG. 2.
Inhibition of DNA synthesis and preferential delay in cells in mid- and late S phase for several hours after removal of CPT. (A) Experimental protocol for global DNA synthesis measurement. HT29 cells were treated with 1 μM CPT for 30 min. CPT was washed out (W), and cells were grown in drug-free medium for the indicated times. [3H]TdR was incorporated into the DNA for 10 min at the end of each time point and measured by trichloroacetic acid precipitation. (B) [3H]TdR incorporation at the indicated times after CPT removal. Shown are averages ± SEM of three experiments. (C) Experimental protocol for measuring S-phase progression. HT29 cells were pulse-labeled with 50 μM BrdU for 30 min, washed (W), and then treated with 1 μM CPT for 30 min. CPT was removed, and the S-phase population was monitored immediately after treatment (0 h) and at the indicated times after removal of CPT (2, 4, 6, 8, and 16 h). (D) FACS profiles for untreated cells (control: CL). (E) FACS profiles for CPT-treated cells. Panels D and E show the results of one of three similar experiments. (F) Phosphorylation of Chk1 on serine-317 immediately after CPT treatment (0 h) and at the indicated times after removal of the drug (2 to 8 h). (G) Similar samples were run for phosphorylation of Chk2 on threonine-68.
FIG. 3.
FIG. 3.
Preferential inhibition of DNA replication in mid- to late-S-phase cells. (A) Experimental protocol. W, wash. (B) Confocal microscopy images of representative cells in early (E) or mid- to late (M) S phase. Replication foci were labeled with CldU (green) and IdU (red). The ratio of IdU (mean pixel intensity) to CldU (mean pixel intensity) is shown for each representative cell (a to h) (M, mid-S phase; E, early S phase). (C) IdU/CldU ratio in untreated and CPT-treated cells (37 cells were counted in each group). (D) Percentage of BrdU-positive cells after CPT treatment; early- and late-S-phase populations are expressed as a percentage of the corresponding untreated populations (average ± SEM of three independent experiments).
FIG. 4.
FIG. 4.
γ-H2AX foci coincide with DNA replication foci. (A) Experimental protocol. Cells were fixed at 0, 2, and 4 h after IdU and CPT pulse treatments. (B) Confocal microscopy images of a representative early (E) or mid- to late (M/L) S-phase cell at the indicated times after CPT removal. Cells were stained with anti-IdU (red) and anti-γ-H2AX (green) antibodies. (C) Confocal microscopy images of untreated cells immediately after the IdU pulse-label (corresponding to 0 h in panel A). The images in panels B and C were adjusted for maximum clarity, not to compare intensity. One representative of three similar experiments is shown.
FIG. 5.
FIG. 5.
CPT treatment inhibits ongoing replication in preexisting replication foci and blocks the formation of new replication foci by activating an intra-S-phase checkpoint, which is abrogated by UCN-01, CHIR-124, and Chk1 siRNA. (A) Experimental protocol. Drug concentrations: CPT, 1 μM; UCN-01, 0.3 μM; CHIR-124, 0.1 μM. (B) Immunoblot analysis of Chk1 protein expression in nontransfected cells (CL), cells transfected with control siRNA, and cells transfected with Chk1 siRNA. The graph depicts the quantitation of two experiments, with a typical Western blot shown below. (C to H) Confocal microscopy images of representative cells. (C) Control, untreated cells; (D) cells treated with CPT and then grown in drug-free medium for up to 6 h. (E and F) Cells treated with CPT followed by addition of UCN-01 (E) or CHIR-124 (F) 2 h after CPT removal (see protocol in panel A). (G) Cells transfected with nonspecific siRNA. (H) Cells transfected with siRNA against Chk1. Similar results were observed in three independent experiments.
FIG. 6.
FIG. 6.
Checkpoint control on the initiation of DNA replication after CPT treatment. (A) Experimental protocol. IdU and CldU (100 μM) were added sequentially to cell cultures for 45 min each. IdU was detected with specific antibodies in green, with CldU in red. CPT (2.5 μM) was added for 30 min during the IdU pulse. When indicated, UCN-01 (0.3 μM) was present during both pulses. (B) Schematic drawing and representative images of two replication signals from DNA fibers. At the top, two DNA replication forks moved bidirectionally from an origin (indicated by the diverging black arrows) that was activated before the IdU pulse. Each fork was labeled with both IdU (green) and CldU (red). At the bottom, the replication bubble resulting from an origin that has been activated during the CldU pulse produces a red-only signal. This population of new later origins had been activated after the CPT treatment. (C) Frequencies of new origins activated during the CldU pulse in untreated conditions, with CPT, with UCN-01, and with both CPT and UCN-01. The frequency (as a percentage) was calculated as the number of red signals (b in panel B) divided by the total (a + b) of red (b) plus green/red signals (a in panel B). The table above the histogram shows the actual values and the percentage of new origins for each treatment. Signals were compiled from two independent experiments. The asterisk indicates a significant effect of UCN-01 upon CPT-induced inhibition of replication origin firing (P = 0.01).
FIG. 7.
FIG. 7.
Checkpoint control of the elongation of DNA replication after CPT. (A) Experimental protocol. IdU and CldU (100 μM) were added sequentially to the cell cultures for 45 min each. IdU was detected with specific antibodies, in green, with CldU in red. CPT (2.5 μM) was added during the IdU pulse. The Chk1 inhibitors UCN-01 (0.3 μM) or CHIR-124 (0.1 μM) were added during both pulses. (B) Representative replication signals observed on DNA fibers obtained by using the protocol depicted in panel A. In the untreated condition, the length of the green and red tracks should be about equal since the forks progress unperturbed during the two pulses. The red signal is shorter after CPT because of the replication block induced by the drug. The Chk1 inhibitors UCN-01 and CHIR-124 tended to restore the normal length of the red signal. (C) Schematic representation of the measurement of CldU and IdU signals. The CldU/IdU ratio was used to determine elongation. (D) Histograms showing the distribution of elongation ratios calculated in the indicated conditions. In untreated cells, the median ratio is close to 1, as expected. The peak was left-shifted after CPT treatment. The peak tended to be shifted back toward 1 when cells were coincubated with UCN-01 or CHIR-124. The dotted line shows a ratio of 1. Comparison of untreated versus CPT-treated cells, CPT versus CPT+UCN-01-treated cells, and CPT versus CPT+CHIR124-treated cells showed a significant difference (P < 0.001 [Kolmogorov-Smirnov test]). (E) Histograms showing CPT-induced inhibition of DNA replication elongation in cells transfected with a control siRNA. (F) Same analyses as in panel E but in cells transfected with siRNA targeting Chk1. Comparison of control siRNA+CPT versus Chk1 siRNA+CPT showed a significant difference (P < 0.001 [Kolmogorov-Smirnov test]).
FIG. 8.
FIG. 8.
Loss of the intra-S-phase checkpoint by UCN-01 increases DNA damage measured as γ-H2AX foci. (A to D) Representative images of γ-H2AX foci (green) alone (left panels) and with propidium iodide staining (red; right panels). (A) Control (CL) untreated HT29 cells; (B) γ-H2AX immunofluorescence after CPT removal (protocol shown at the bottom of panel E); (C) γ-H2AX immunofluorescence in cells treated with UCN-01 alone; (D) γ-H2AX immunofluorescence in cells treated with UCN-01 after CPT removal. (E) γ-H2AX fluorescence (average per cell) for the experiment depicted in panels A to D (mean ± SEM). AU, arbitrary units. (F) Colocalization of γ-H2AX foci (green) and IdU (red) in representative early- and mid- to late-S-phase cells. The images represent one of three similar experiments.

References

    1. Anglana, M., F. Apiou, A. Bensimon, and M. Debatisse. 2003. Dynamics of DNA replication in mammalian somatic cells: nucleotide pool modulates origin choice and interorigin spacing. Cell 114:385-394. - PubMed
    1. Avemann, K., R. Knippers, T. Koller, and J. M. Sogo. 1988. Camptothecin, a specific inhibitor of type I DNA topoisomerase, induces DNA breakage at replication forks. Mol. Cell. Biol. 8:3026-3034. - PMC - PubMed
    1. Berezney, R., D. D. Dubey, and J. A. Huberman. 2000. Heterogeneity of eukaryotic replicons, replicon clusters, and replication foci. Chromosoma 108:471-484. - PubMed
    1. Bjornsti, M. A., P. Benedetti, G. A. Viglianti, and J. C. Wang. 1989. Expression of human DNA topoisomerase I in yeast cells lacking yeast DNA topoisomerase I: restoration of sensitivity of the cells to the antitumor drug camptothecin. Cancer Res. 49:6318-6323. - PubMed
    1. Bosco, E. E., C. N. Mayhew, R. F. Hennigan, J. Sage, T. Jacks, and E. S. Knudsen. 2004. RB signaling prevents replication-dependent DNA double-strand breaks following genotoxic insult. Nucleic Acids Res. 32:25-34. - PMC - PubMed

Publication types

LinkOut - more resources