. 2007 Jul;27(14):5147-60.
doi: 10.1128/MCB.02429-06. Epub 2007 May 21.

Epigenetic regulation of tumor necrosis factor alpha

Affiliations

Epigenetic regulation of tumor necrosis factor alpha

K E Sullivan et al. Mol Cell Biol. 2007 Jul.

Abstract

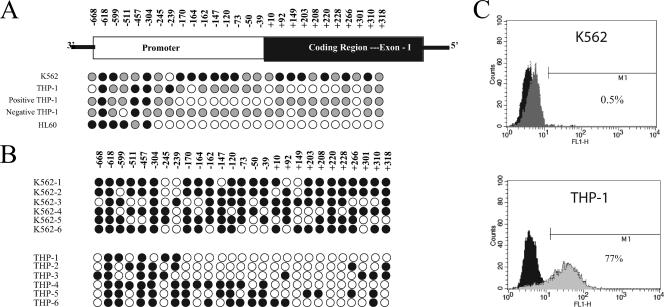
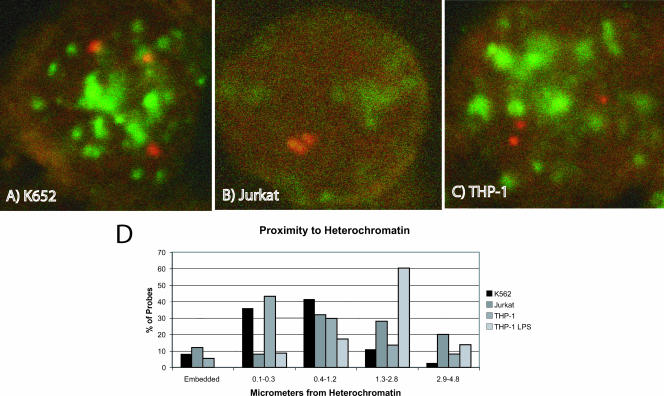
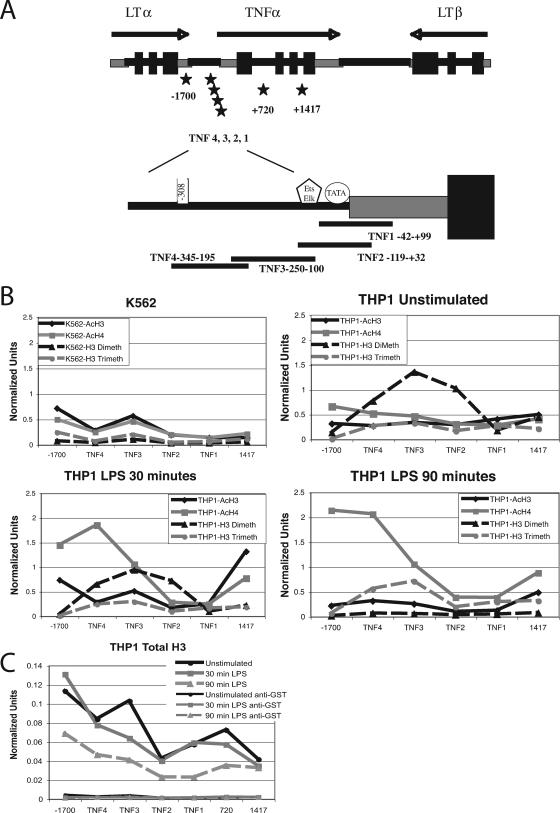
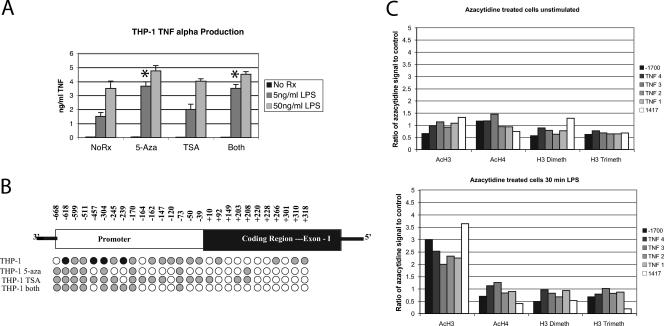
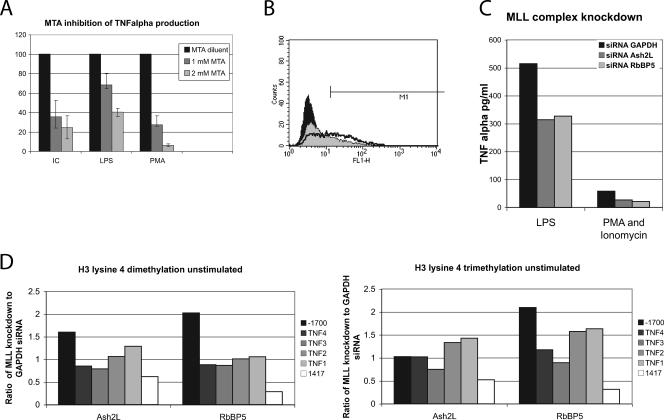
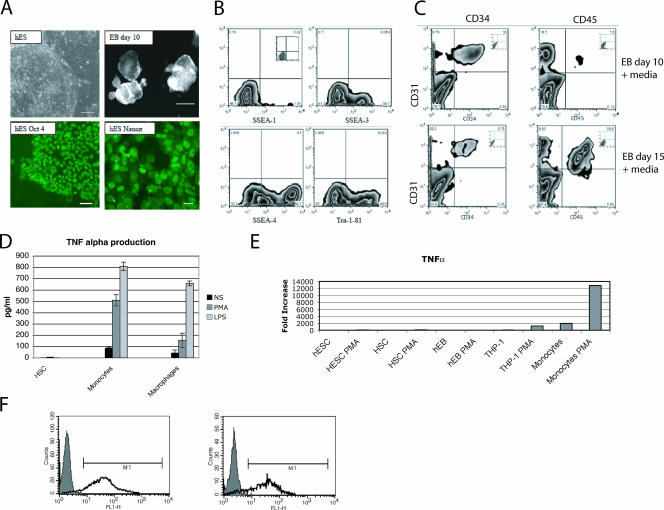
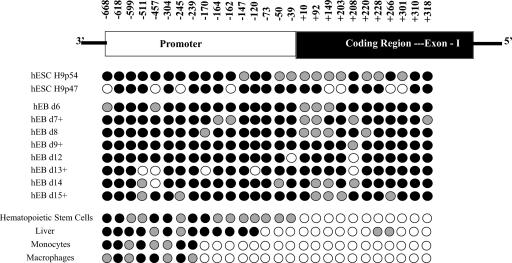
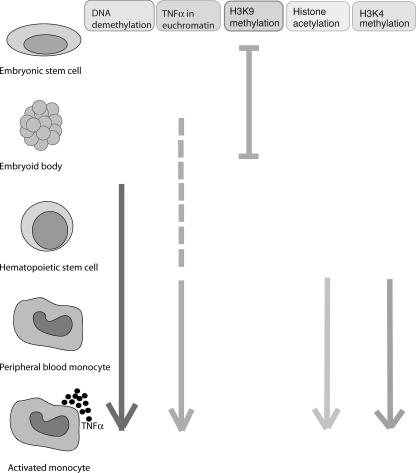
Tumor necrosis factor alpha (TNF-alpha) is a potent cytokine which regulates inflammation via the induction of adhesion molecules and chemokine expression. Its expression is known to be regulated in a complex manner with transcription, message turnover, message splicing, translation, and protein cleavage from the cell surface all being independently regulated. This study examined both cell lines and primary cells to understand the developmental regulation of epigenetic changes at the TNF-alpha locus. We demonstrate that epigenetic modifications of the TNF-alpha locus occur both developmentally and in response to acute stimulation and, importantly, that they actively regulate expression. DNA demethylates early in development, beginning with the hematopoietic stem cell. The TNF-alpha locus migrates from heterochromatin to euchromatin in a progressive fashion, reaching euchromatin slightly later in differentiation. Finally, histone modifications characteristic of a transcriptionally competent gene occur with myeloid differentiation and progress with differentiation. Additional histone modifications characteristic of active gene expression are acquired with stimulation. In each case, manipulation of these epigenetic variables altered the ability of the cell to express TNF-alpha. These studies demonstrate the importance of epigenetic regulation in the control of TNF-alpha expression. These findings may have relevance for inflammatory disorders in which TNF-alpha is overproduced.


Figures

FIG. 1.
FIG. 1.
Bisulfite analysis of DNA methylation in cell lines. Filled black circles represent >80% methylation at a given CpG after sequencing 5 to 10 individual clones. A gray circle represents between 20 and 80% methylation at a given CpG. An open circle represents <20% methylation at a given CpG. (A) Three cell lines were analyzed as representative of cells incapable of producing TNF-α (K562) and competent to produce TNF-α (THP-1 and HL-60). THP-1 cells were stimulated with LPS, sorted by flow cytometry based on expression of TNF-α, and analyzed by bisulfite conversion. These results are indicated as positive (+) and negative (−). (B) Individual clones of two partially methylated cell lines (K562 and THP-1). THP-1 cells show significant heterogeneity in the pattern of methylation between clones, whereas K562 has sporadic bases demethylated on all clones. (C) Flow cytometry demonstrating the cell lines' competence to produce TNF-α. K562 cells (top panel) were stimulated with 100 ng/ml of PMA for 6 h. (K562 does not express TLR4 or CD14 receptors for LPS.) THP-1 cells (lower panel) were stimulated with 1 μg/ml of LPS for 6 h. The black fill represents the unstimulated cells stained with the anti-TNF-α antibody. The gray fill represents the stimulated cells.
FIG. 2.
FIG. 2.
FISH analyses of nuclear localization of the TNF-α locus. The THP-1 and K562 cell lines are triploid for chromosome 6. The confocal panels show representative cells. Centromere probes are shown in green (FITC), and the TNF-α locus is shown in red (Spectrum orange). The graph shows the cumulative findings from 10 to 20 cells. (A) K562 cells. One locus is in heterochromatin in the upper right corner. (B) Jurkat cells. (C) THP-1 cells. All three loci are in euchromatin. (D) Graphical representation of the proximity of the TNF-α loci to the closest centromeric heterochromatin. “THP-1-LPS” refers to THP-1 cells treated with 1 μg/ml of LPS. A distance of ≤0.3 μm is considered localization to heterochromatin.
FIG. 3.
FIG. 3.
Histone acetylation and methylation at the TNF-α locus. These results represent an average of duplicates or triplicates of two to three separate experiments. The normalized units represent the signal from the immunoprecipitate normalized to 10% of the original input DNA. (A) Schematic representation of the primers and probes used for real-time PCR quantitation. (B) Graphical representation of ChIP analyses. AcH3, acetylated H3; AcH4, acetylated H4; H3 Dimeth, H3K4 dimethylation; H3 Trimeth, H3K4 trimethylated. (C) Total H3 ChIP.
FIG. 4.
FIG. 4.
Modification of epigenetic context alters the competence to produce TNF-α. (A) THP-1 cells were treated for 24 h with 100 nM TSA, 250 nM 5-azacytidine (5-Aza), or both and stimulated with 5 or 50 ng/ml of LPS. TNF-α was measured after 6 h by ELISA. 5-Azacytidine increased TNF-α production more significantly than TSA. At 24 h of treatment, the cells remained >90% viable. Longer courses of treatment (Rx) impaired viability. *, P < 0.01. (B) Prolonged 5-azacytidine treatment led to demethylation of the promoter in THP-1 cells, while TSA treatment did not markedly alter the methylation status. (C) 5-Azacytidine treatment of THP-1 cells for 48 h did not substantially alter the pattern of histone modifications. Levels of modification are displayed as a ratio of 5-azacytidine-treated cells to control THP-1 cells.
FIG. 5.
FIG. 5.
(A) The histone methylation inhibitor MTA markedly decreased the ability of the cells to produce TNF-α, as detected by ELISA. The results are expressed as a percentage of the TNF-α produced by each stimulus in the absence of the MTA inhibitor. “IC” represents rabbit anti-bovine serum albumin immune complexes at 1 μg/ml. MTA diminishes the response to all stimuli. (B) The methylation inhibitor MTA reduced the ability of the cells to produce TNF-α by flow cytometry. Only 0.6% of the cells were positive by flow cytometry when unstimulated. After treatment with 1 μg/ml of LPS for 6 h, 47.6% of the cells were positive and had a mean fluorescent intensity of 56.3 U (black line). MTA pretreatment followed by LPS stimulation led to 19.5% of the cells being positive, with a mean fluorescent intensity of 39.9 U (gray fill). The black fill represents unstimulated, untreated cells. (C) ELISA study of siRNA-transfected THP-1 cells. Cells were stimulated for 6 h with 100 ng/ml of LPS 48 h after transfections, and supernatants were tested for TNF-α. siRNAs directed at Ash2L and RbBP5 have been shown to compromise H3 lysine 4 dimethylation and trimethylation. (D) The two MLL knockdown siRNAs and siRNA to GAPDH were transfected in to THP-1 cells in parallel cultures. The data are expressed as the signal in the Ash2L- and RbBP5-transfected cells normalized to GAPDH. H3 lysine 4 dimethylation was increased in the MLL knockdowns in the 3′ region of LTα and clearly decreased in the TNF-α third intron enhancer region.
FIG. 6.
FIG. 6.
Primary cell characterization. (A) Undifferentiated hESCs and hEBs. Undifferentiated hESC culture, phase contrast, bar = 100 μm; Oct 4-stained undifferentiated hESC colony, bar = 50 μm; Nanog-stained undifferentiated hESC colony, bar = 50 μm; hEBs, day 10, bar = 500 μm. (B) Flow cytometry analysis of undifferentiated hESCs. SSEA-1, SSEA-3, SSEA-4, and Tra-1-81 (inset is the isotype control) were used to confirm the features of ESCs. (C) Flow cytometry analysis of hEBs in EB medium plus cytokines plus BMP-2 at day 10 and day 15. Hematopoietic markers: CD31 (y axis), CD34, and CD45. Insets are isotype controls. (D) Hematopoietic stem cells (HSC) do not produce TNF-α by ELISA. Cells were stimulated with PMA and ionomycin, 1 μg/ml of LPS, or diluent (NS) for 6 h. TNF-α was measured by ELISA. (E) Cells from early differentiation states do not produce TNF-α message. Cells were mock treated or treated with 100 ng/ml PMA and 500 ng/ml of ionomycin for 3 h. RNA was isolated and reverse transcribed. The untreated ESCs were used as the calibrator. cDNA quantity is expressed as increase (fold) over unstimulated ESCs. (F) Peripheral blood monocytes are largely competent for the production of TNF-α. Two different preparations of monocytes stimulated with LPS are shown using intracellular flow cytometry.
FIG. 7.
FIG. 7.
DNA methylation status of the TNF-α locus in primary cells. The legend is as for Fig. 1. Cell sources were undifferentiated hESCs, hEBs harvested at various times in culture (+, growth in cytokine-supplemented media), hematopoietic stem cells (HSC) purified from a peripheral blood harvest, human liver, peripheral blood monocytes purified by elutriation, and peripheral blood monocytes differentiated by adherence for 7 days into macrophages.
FIG. 8.
FIG. 8.
(A) Nuclear localization of the TNF-α locus in primary cells. Centromere probes are shown in green (FITC), and the TNF-α locus is shown in red (Spectrum orange). Each section is between 3 and 10 μm thick. (B) Graphical representation of the proximity of the TNF-α probe to the nearest centromeric heterochromatin. Differentiation is accompanied by gradual movement from heterochromatin to euchromatin. Undiff, undifferentiated.
FIG. 9.
FIG. 9.
Histone modifications in primary cells. (A) ChIP analyses were performed utilizing the same primer-probe combinations as in Fig. 3. The abbreviations are as defined in the legend to Fig. 3. Hematopoietic stem cells (HSC) were examined untreated. Primary monocytes were examined fresh as well as 30 min and 90 min after 1-μg/ml LPS stimulation. These results represent an average of duplicates or triplicates and at least two separate experiments. (B) H3 lysine 9 trimethylation, a repressive mark, was examined in hematopoietic stem cells and peripheral blood monocytes. The NTERA-2cl.D2 cell line was used as a positive control.
FIG. 10.
FIG. 10.
Summary of epigenetic changes at the TNF-α locus during development.

Similar articles

Cited by

References

    1. Amour, A., P. M. Slocombe, A. Webster, M. Butler, C. G. Knight, B. J. Smith, P. E. Stephens, C. Shelley, M. Hutton, V. Knauper, A. J. Docherty, and G. Murphy. 1998. TNF-alpha converting enzyme (TACE) is inhibited by TIMP-3. FEBS Lett. 435:39-44. - PubMed
    1. Appelberg, R., A. Sarmento, and A. G. Castro. 1995. Tumour necrosis factor-alpha (TNF-alpha) in the host resistance to mycobacteria of distinct virulence. Clin. Exp. Immunol. 101:308-313. - PMC - PubMed
    1. Armenante, F., M. Merola, A. Furia, and M. Palmieri. 1999. Repression of the IL-6 gene is associated with hypermethylation. Biochem. Biophys. Res. Commun. 258:644-647. - PubMed
    1. Askling, J., M. Fored, E. Baecklund, L. Brandt, C. Backlin, A. Ekbom, C. Sundstrom, L. Bertilsson, L. Coster, P. Geborek, L. Jacobsson, S. Lindblad, J. Lysholm, S. Rantapaa-Dahlqvist, T. Saxne, L. Klareskog, and N. Feltelius. 2005. Hematopoietic malignancies in rheumatoid arthritis. Lymphoma risk and characteristics following TNF-antagonists. Ann. Rheum. Dis. 64:1414-1420. (First published 20 April 2005; doi:10.1136/ard.2004.033241.) - DOI - PMC - PubMed
    1. Barthel, R., and A. E. Goldfeld. 2003. T cell-specific expression of the human TNF-alpha gene involves a functional and highly conserved chromatin signature in intron 3. J. Immunol. 171:3612-3619. - PubMed

Publication types

MeSH terms

LinkOut - more resources