. 2007 Jul;27(14):5090-104.
doi: 10.1128/MCB.00083-07. Epub 2007 May 21.

Genomic analyses of transcription factor binding, histone acetylation, and gene expression reveal mechanistically distinct classes of estrogen-regulated promoters

Affiliations

Genomic analyses of transcription factor binding, histone acetylation, and gene expression reveal mechanistically distinct classes of estrogen-regulated promoters

Miltiadis Kininis et al. Mol Cell Biol. 2007 Jul.

Abstract

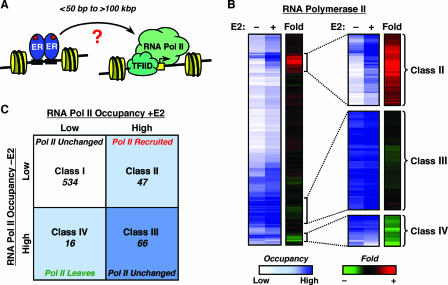
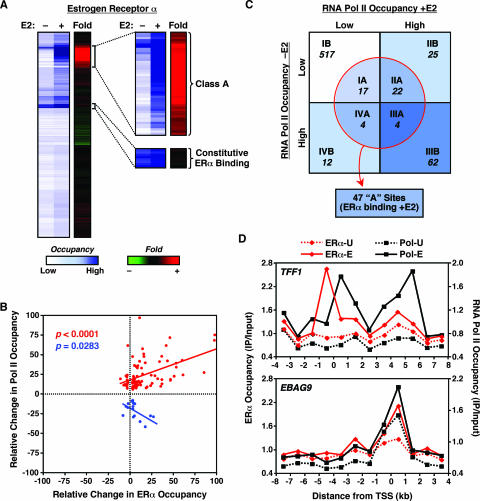
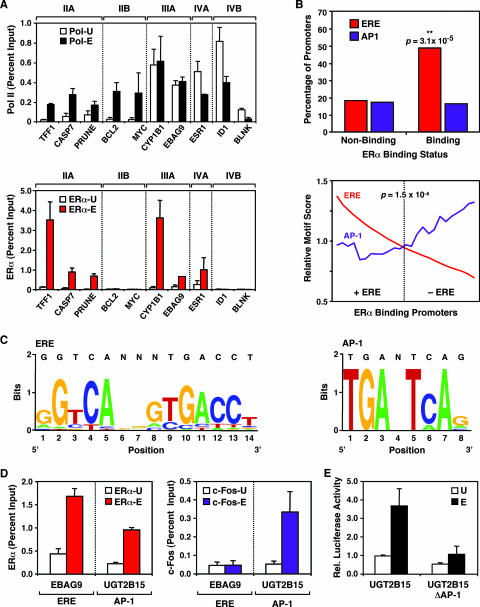
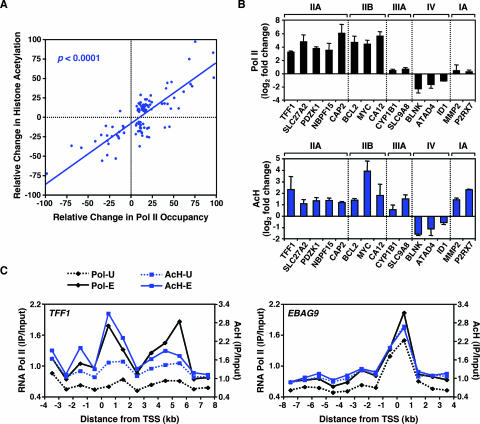
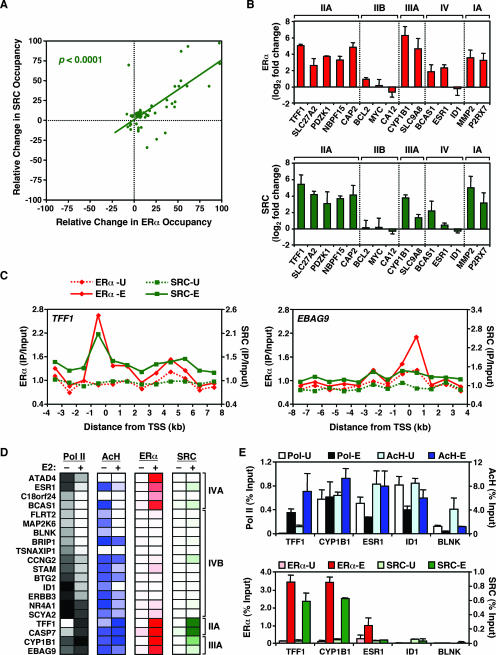
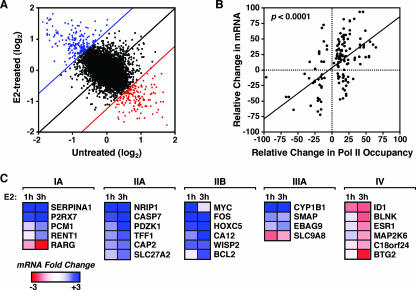
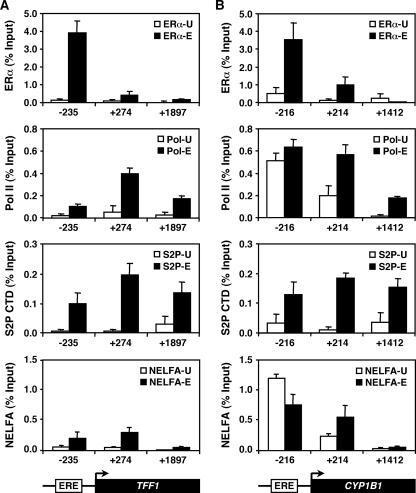
To explore the global mechanisms of estrogen-regulated transcription, we used chromatin immunoprecipitation coupled with DNA microarrays to determine the localization of RNA polymerase II (Pol II), estrogen receptor alpha (ERalpha), steroid receptor coactivator proteins (SRC), and acetylated histones H3/H4 (AcH) at estrogen-regulated promoters in MCF-7 cells with or without estradiol (E2) treatment. In addition, we correlated factor occupancy with gene expression and the presence of transcription factor binding elements. Using this integrative approach, we defined a set of 58 direct E2 target genes based on E2-regulated Pol II occupancy and classified their promoters based on factor binding, histone modification, and transcriptional output. Many of these direct E2 target genes exhibit interesting modes of regulation and biological activities, some of which may be relevant to the onset and proliferation of breast cancers. Our studies indicate that about one-third of these direct E2 target genes contain promoter-proximal ERalpha-binding sites, which is considerably more than previous estimates. Some of these genes represent possible novel targets for regulation through the ERalpha/AP-1 tethering pathway. Our studies have also revealed several previously uncharacterized global features of E2-regulated gene expression, including strong positive correlations between Pol II occupancy and AcH levels, as well as between the E2-dependent recruitment of ERalpha and SRC at the promoters of E2-stimulated genes. Furthermore, our studies have revealed new mechanistic insights into E2-regulated gene expression, including the absence of SRC binding at E2-repressed genes and the presence of constitutively bound, promoter-proximally paused Pol IIs at some E2-regulated promoters. These mechanistic insights are likely to be relevant for understanding gene regulation by a wide variety of nuclear receptors.


Figures

FIG. 1.
FIG. 1.
Regulation of RNA Pol II occupancy by E2 at target promoters in MCF-7 cells. (A) Schematic representation of short-range and long-range regulation of RNA Pol II by liganded ERα. Changes in the recruitment or activity of RNA Pol II complexes at the promoter represent the functional outcomes of liganded ERα binding to its cognate enhancers across the genome. TFIID, transcription factor IID. (B) RNA Pol II genomic location analysis by ChIP-chip in MCF-7 cells. Data from all the filtered elements on the custom estrogen-regulated promoter array are represented by heat maps. The relative occupancy of each genomic fragment by RNA Pol II with or without E2 treatment is shown in the blue/white scale, whereas the change (n-fold) of RNA Pol II occupancy upon E2 treatment is shown in the red/green scale. The expanded images on the right highlight some of the interesting classes of genes shown in panel C. (C) Classification of RNA Pol II binding sites. Each quadrant in the graphical representation indicates the number of filtered elements from the array exhibiting one of four different patterns of RNA Pol II occupancy (e.g., for class II, low occupancy, −E2; high occupancy, +E2).
FIG. 2.
FIG. 2.
Cooccupancy of RNA Pol II and ERα at target promoters in MCF-7 cells. (A) ERα genomic location analysis by ChIP-chip in MCF-7 cells. Data from all of the elements on the custom estrogen-regulated promoter array are represented by heat maps, as described for RNA Pol II in Fig. 1B. The expanded images on the right highlight the “class A” regions shown in panel C and constitutively ERα-bound promoters. (B) Correlation between ERα and RNA Pol II occupancy at estrogen-regulated promoters. The relative change in factor occupancy is defined as the log2 change (n-fold) in occupancy upon E2 treatment as a percentage of the maximum log2 change (n-fold) observed for each factor. The red data points show the data from a collection of promoters for which estrogen-dependent ERα recruitment correlates positively with RNA Pol II recruitment (correlation coefficient = 0.43 [P < 0.0001]). The blue data points show the data from a collection of promoters for which estrogen-dependent ERα recruitment correlates negatively with RNA Pol II recruitment (correlation coefficient = −0.53 [P = 0.0283]). All elements from the promoter array showing significant E2-dependent enrichment (P < 0.05) were included in the analysis. (C) Classification of ERα-binding sites based on RNA Pol II occupancy. The class A regions (within the circle) include 47 sites where ERα is recruited upon E2 treatment, 37 of which are gene promoters. The class B regions are those for which no ERα recruitment was observed. The distribution of the class A and B regions is superimposed on the representation of the RNA Pol II classes I, II, III, and IV from Fig. 1C. (D) ChIP-chip tiling for the TFF1 and EBAG9 genes. Occupancy, expressed as ChIP enrichment ratios (IP/input), for ERα and RNA Pol II throughout the indicated genomic region is shown in the absence (-U) or presence (-E) of E2. “0” represents the annotated TSS; regions upstream of the TSS are indicated by negative numbers.
FIG. 3.
FIG. 3.
Gene-by-gene validation of RNA Pol II and ERα promoter occupancy coupled with ERα-binding sequence analyses. (A) Validation by ChIP-qPCR of the ChIP-chip results for selected promoters from the estrogen-regulated promoter array. Results for RNA Pol II (upper graph) and ERα (lower graph) are shown. The empty and filled bars represent ChIP enrichment for untreated (-U) and E2-treated (-E) cells, respectively. The class IIA, IIB, IIIA, IVA, and IVB promoters are as described for Fig. 2C. Each bar represents the mean + standard error of the mean (SEM) for at least three separate determinations. (B) Sequence analysis of ERα-binding and nonbinding promoters. Motif-finding algorithms were used to search for ERE- and AP-1-like sequences in the ERα-binding and nonbinding promoters from the promoter microarray, as described in Materials and Methods. (Top) Percentage of promoters in each category (i.e., ERα binding or ERα nonbinding) containing ERE- or AP-1-like sequences; (bottom) analysis of the coexistence of ERE- and AP-1-like sequences in the set of ERα-binding promoters. Relative ERE and AP-1 motif scores are plotted for each sequence. The dotted line represents the significance threshold (P = 1.5 × 10⁻⁴) for determining ERE-like sequences. A moving-average analysis was performed by calculating the average motif score of a sliding window of 13 regions from high to low ERE scores. (C) Sequence logos for the ERE-like (left) and AP-1-like (right) elements identified in the ERα-binding promoters are shown. (D) ChIP-qPCR assay of ERα recruitment (left graph) and c-Fos recruitment (right graph) to the EBAG9 promoter, an “ERE-only” (i.e., ERE-positive/AP-1 site-negative) promoter, and the UGT2B15 promoter, an “AP-1-only” (i.e., ERE-negative/AP-1 site-positive) promoter, in response to E2. The empty and filled bars represent ChIP enrichment for untreated and E2-treated cells, respectively. Each bar represents the mean + SEM for at least three separate determinations. Schematics of the EBAG9 and UGT2B15 promoters can be found in Fig. S3 at http://mbg.cornell.edu/cals/mbg/research/kraus-lab/sm.cfm. (E) Luciferase reporter gene assays examining the role of a promoter-proximal AP-1 site in the E2-dependent regulation of the UGT2B15 promoter. UGT2B15-luciferase reporter constructs, with or without the promoter-proximal AP-1 site (UGT2B15 and UGT2B15 ΔAP-1, respectively), were transfected into MCF-7 cells and subsequently treated with E2 as described in Materials and Methods. Each bar represents the mean + SEM for at least three separate determinations.
FIG. 4.
FIG. 4.
RNA Pol II occupancy correlates with histone acetylation at the promoters of E2-regulated genes. (A) Correlation between E2-dependent RNA Pol II recruitment and histone H3 and H4 acetylation. The relative change in histone acetylation or Pol II occupancy is defined as the log2 change (n-fold) upon E2 treatment as a percentage of the maximum log2 change (n-fold) observed for each factor. The correlation coefficient is 0.73 (P < 0.0001). All array elements with significant ChIP enrichment ratios (P < 0.05) were included in the analysis. (B) Validation by ChIP-qPCR of the ChIP-chip results for selected promoters from the estrogen-regulated promoter array. Results for RNA Pol II (upper graph; black) and AcH (lower graph; blue) are shown. The class IIA, IIB, IIIA, IV, and IA promoters are as shown in Fig. 2C. Each bar represents the mean + SEM for at least three separate determinations. (C) ChIP-chip tiling for the TFF1 and EBAG9 genes. Occupancy, expressed as ChIP enrichment ratios (IP/input), for RNA Pol II and AcH throughout the indicated genomic region is shown in the absence (-U) or presence (-E) of E2. “0” represents the TSS; regions upstream of the TSS are indicated by negative numbers.
FIG. 5.
FIG. 5.
ERα recruitment correlates with SRC recruitment to the promoters of E2-stimulated, but not E2-repressed, genes. (A) Correlation between E2-dependent ERα recruitment and SRC recruitment to gene promoters. The relative change in factor occupancy is defined as the log2 change (n-fold) in occupancy upon E2 treatment as a percentage of the maximum log2 change (n-fold) observed for each factor. The correlation coefficient is 0.78 (P < 0.0001). All array elements with significant ChIP enrichment ratios (P < 0.05) were included in the analysis. (B) Validation by ChIP-qPCR of the ChIP-chip results for selected promoters from the estrogen-regulated promoter array. Results for ERα (upper graph; red) and SRC (lower graph; green) are shown. The class IIA, IIB, IIIA, IV, and IA promoters are as shown in Fig. 2C. Each bar represents the mean + SEM for at least three separate determinations. (C) ChIP-chip tiling for the TFF1 and EBAG9 genes. Occupancy, expressed as ChIP enrichment ratios (IP/input), for ERα and SRC throughout the indicated genomic region is shown in the absence (-U) or presence (-E) of E2. “0” represents the TSS; regions upstream of the TSS are indicated by negative numbers. (D) ChIP-chip data showing Pol II, ERα, and SRC occupancy, as well as AcH levels, for a set of E2-repressed promoters before and after E2 treatment. Data for all class IV promoters, as well as for some class IIA and class IIIA promoters, are shown. The intensity of the color in each group indicates the strength of ChIP-chip signal, with white indicating no signal. (E) Validation by ChIP-qPCR of the ChIP-chip results for selected promoters from panel D. The light- and dark-colored bars for each factor indicate ChIP enrichment for untreated (-U) and E2-treated (-E) cells, respectively. Each bar represents the mean + SEM for at least three separate determinations.
FIG. 6.
FIG. 6.
E2-dependent gene expression correlates with RNA Pol II recruitment to target promoters. (A) RNA expression analysis of MCF-7 cells in the presence or absence of a 3-h treatment with E2 by use of Affymetrix U133A 2.0 microarrays. Scatterplot presentation of normalized signal for each gene on the microarray in E2-treated cells (y axis) plotted versus the signal for each gene from untreated cells (x axis). The blue and red lines represent the twofold increase or decrease cutoffs for expression, respectively. Genes showing E2-dependent increases in expression are in blue, whereas genes showing E2-dependent decreases in expression are in red. Genes regulated less than twofold by E2 are in black. (B) Correlation between E2-dependent RNA Pol II recruitment and mRNA expression. The relative change in mRNA or Pol II occupancy is defined as the log2 change (n-fold) upon E2 treatment as a percentage of the maximum log2 change (n-fold) observed for each factor. The correlation coefficient is 0.45 (P < 0.0001). All promoters showing significant changes (P < 0.05) for RNA expression and RNA Pol II ChIP recruitment were included in the analysis. (C) Gene-by-gene confirmation of expression microarray results. MCF-7 cells were treated with or without E2 for 1 h or 3 h, and then RNA was isolated and analyzed by qPCR for genes in classes IA, IIA, IIB, IIIA, and IV (from Fig. 2C). The mRNA expression scale is shown.
FIG. 7.
FIG. 7.
E2-dependent regulation of constitutively bound Pol II at target promoters. ChIP-qPCR was used to determine the occupancy by ERα, Pol II, Ser2-phosphorylated Pol II, and NELFA at the TFF1 (A) and CYP1B1 (B) promoters. The empty and filled/hatched bars represent ChIP enrichment for untreated (-U) and E2-treated (-E) cells, respectively. “−” and “+” indicate the regions upstream and downstream of the TSS, respectively. Each bar represents the mean + SEM for at least three separate determinations.

Similar articles

Cited by

References

    1. Acevedo, M. L., K. C. Lee, J. D. Stender, B. S. Katzenellenbogen, and W. L. Kraus. 2004. Selective recognition of distinct classes of coactivators by a ligand-inducible activation domain. Mol. Cell 13:725-738. - PubMed
    1. Aiyar, S. E., J. L. Sun, A. L. Blair, C. A. Moskaluk, Y. Z. Lu, Q. N. Ye, Y. Yamaguchi, A. Mukherjee, D. M. Ren, H. Handa, and R. Li. 2004. Attenuation of estrogen receptor alpha-mediated transcription through estrogen-stimulated recruitment of a negative elongation factor. Genes Dev. 18:2134-2146. - PMC - PubMed
    1. Andrau, J. C., L. van de Pasch, P. Lijnzaad, T. Bijma, M. G. Koerkamp, J. van de Peppel, M. Werner, and F. C. Holstege. 2006. Genome-wide location of the coactivator mediator: binding without activation and transient Cdk8 interaction on DNA. Mol. Cell 22:179-192. - PubMed
    1. Blais, A., and B. D. Dynlacht. 2005. Constructing transcriptional regulatory networks. Genes Dev. 19:1499-1511. - PubMed
    1. Bodescot, M., and O. Brison. 1996. Characterization of new human c-myc mRNA species produced by alternative splicing. Gene 174:115-120. - PubMed

Publication types

MeSH terms