. 2007 May 29;104(22):9301-6.
doi: 10.1073/pnas.0702866104. Epub 2007 May 21.

Live-cell imaging reveals sequential oligomerization and local plasma membrane targeting of stromal interaction molecule 1 after Ca2+ store depletion

Affiliations

Live-cell imaging reveals sequential oligomerization and local plasma membrane targeting of stromal interaction molecule 1 after Ca2+ store depletion

Jen Liou et al. Proc Natl Acad Sci U S A. .

Abstract

Stromal interaction molecule 1 (STIM1) has recently been identified by our group and others as an endoplasmic reticulum (ER) Ca(2+) sensor that responds to ER Ca(2+) store depletion and activates Ca(2+) channels in the plasma membrane (PM). The molecular mechanism by which STIM1 transduces signals from the ER lumen to the PM is not yet understood. Here we developed a live-cell FRET approach and show that STIM1 forms oligomers within 5 s after Ca(2+) store depletion. These oligomers rapidly dissociated when ER Ca(2+) stores were refilled. We further show that STIM1 formed oligomers before its translocation within the ER network to ER-PM junctions. A mutant STIM1 lacking the C-terminal polybasic PM-targeting motif oligomerized after Ca(2+) store depletion but failed to form puncta at ER-PM junctions. Using fluorescence recovery after photobleaching measurements to monitor STIM1 mobility, we show that STIM1 oligomers translocate on average only 2 mum to reach ER-PM junctions, arguing that STIM1 ER-to-PM signaling is a local process that is suitable for generating cytosolic Ca(2+) gradients. Together, our live-cell measurements dissect the STIM1 ER-to-PM signaling relay into four sequential steps: (i) dissociation of Ca(2+), (ii) rapid oligomerization, (iii) spatially restricted translocation to nearby ER-PM junctions, and (iv) activation of PM Ca(2+) channels.


Conflict of interest statement

The authors declare no conflict of interest.

Figures
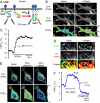
Fig. 1.
Fig. 1.
ER Ca2+ controls STIM1 oligomerization and puncta formation. (A) Schematic representation of a FRET-based assay for STIM1 oligomerization. (B) STIM1 oligomerization and puncta formation in YFP-STIM1 and CFP-STIM1 cotransfected RBL cells. Confocal images were acquired near the adhesion surface before and 90 s after antigen (2 μg/ml dinitrophenol-BSA) stimulation. (Scale bar, 10 μm.) (C) The average STIM1 FRETE trace of 31 RBL cells. The average and SE of t1/2 are shown. (D) Confocal images of YFP-STIM1 and CFP-ER marker cotransfected RBL cells were acquired near the adhesion surface before and 90 s after antigen stimulation. The overlay images show the colocalization of STIM1 (green) and the ER marker (red). (Scale bar, 5 μm.) (E) YFP-STIM1 and CFP-STIM1 cotransfected HeLa cells were stimulated with 100 μM histamine (Hist.) plus 5 μM BHQ in a Ca2+-free buffer for 4 min. Cells were then washed three times, and 10 mM Ca2+ was added back. Confocal images were acquired near the adhesion surface before (Basal), 75 s after stimulation (Store depleted), and 70 s after Ca2+ readdition (Store refilled). (Scale bar, 10 μm.) (F) The average STIM1 FRETE trace of 10 HeLa cells. The average and SE of t1/2 are shown.
Fig. 2.
Fig. 2.
STIM1 oligomerization and translocation to ER–PM junctions are sequential processes. (A) YFP and FRETE images of a YFP-STIM1 and CFP-STIM1 coexpressing HeLa cell acquired near the adhesion surface after 10 μM ionomycin stimulation in a Ca2+-free buffer. (Scale bar, 20 μm.) (B) A kinetic comparison of STIM1 FRETE increases and puncta formation in the same cells. The average FRETE responses of 28 ionomycin-stimulated cells are shown. STIM1 puncta formation was monitored in these cells by measuring the average granule intensity in each cell by using a Gaussian filter (see Materials and Methods). SEs are shown. (C) The average FRETE trace of 29 CFP-STIM1-ΔK and YFP-STIM1-ΔK cotransfected HeLa cells was compared with the wild-type STIM1 FRETE trace shown in B. (D) Confocal images of a YFP-STIM1-ΔK transfected HeLa cell acquired near the adhesion surface after 10 μM ionomycin stimulation in a Ca2+-free buffer. There was no puncta formation in all ionomycin-stimulated YFP-STIM1-ΔK-transfected HeLa cells examined (>100 cells from 30 experiments). (Scale bar, 20 μm.)
Fig. 3.
Fig. 3.
STIM1 ER-to-PM signaling is a local process. (A) YFP-STIM1 diffusion in basal and ionomycin-treated cells monitored by fluorescence recovery after photobleaching measurements. (Scale bar, 10 μm.) (B) The average YFP-STIM1 intensity ratio of two sites inside and outside of the photobleached region (5 μm apart; n = 8 for each condition). (C) A series of relative Gaussian intensity profiles were fit through images such as those shown in A, and the increase in the square of the Gaussian peak radius (a2) was tracked over time to derive an apparent diffusion coefficient. (D) The average diffusion coefficients of YFP-STIM1 before and after Ca2+ store depletion (n = 5 for each condition; SEs are shown).
Fig. 4.
Fig. 4.
Schematic representation of the four steps that define the STIM1 ER-to-PM signaling relay. (Left) When ER stores are loaded with Ca2+, Ca2+ is bound to the EF hand of STIM1, preventing STIM1 oligomerization. (Center) In the first two activation steps, a reduction in luminal ER Ca2+ leads to Ca2+ dissociation from the EF hand, which triggers a rapid oligomerization of STIM1. The oligomerization of STIM1 exposes the C-terminal polybasic PM-targeting motif. (Right) In the next two steps, STIM1 oligomers are recruited via diffusion along the ER network to nearby ER–PM junctions where STIM1 interacts with the PM Ca2+ channel Orai1 and activates SOC influx.

Similar articles

Cited by

References

    1. Berridge MJ, Lipp P, Bootman MD. Nat Rev Mol Cell Biol. 2000;1:11–21. - PubMed
    1. Lewis RS. Annu Rev Immunol. 2001;19:497–521. - PubMed
    1. Parekh AB, Putney JW., Jr Physiol Rev. 2005;85:757–810. - PubMed
    1. Roos J, DiGregorio PJ, Yeromin AV, Ohlsen K, Lioudyno M, Zhang S, Safrina O, Kozak JA, Wagner SL, Cahalan MD, et al. J Cell Biol. 2005;169:435–445. - PMC - PubMed
    1. Liou J, Kim ML, Heo WD, Jones JT, Myers JW, Ferrell JE, Jr, Meyer T. Curr Biol. 2005;15:1235–1241. - PMC - PubMed

Publication types