. 2007 May 29;104(22):9358-63.
doi: 10.1073/pnas.0701214104. Epub 2007 May 21.

The origin of modern metabolic networks inferred from phylogenomic analysis of protein architecture

Affiliations

The origin of modern metabolic networks inferred from phylogenomic analysis of protein architecture

Gustavo Caetano-Anollés et al. Proc Natl Acad Sci U S A. .

Abstract

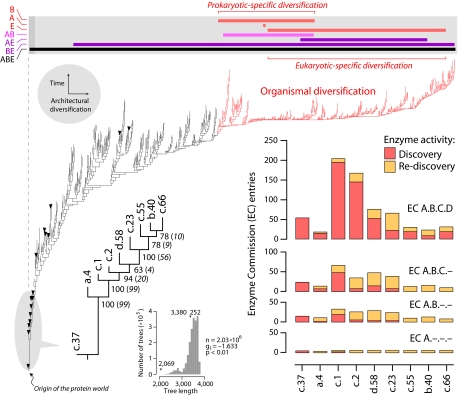
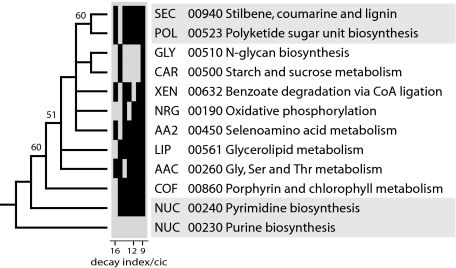
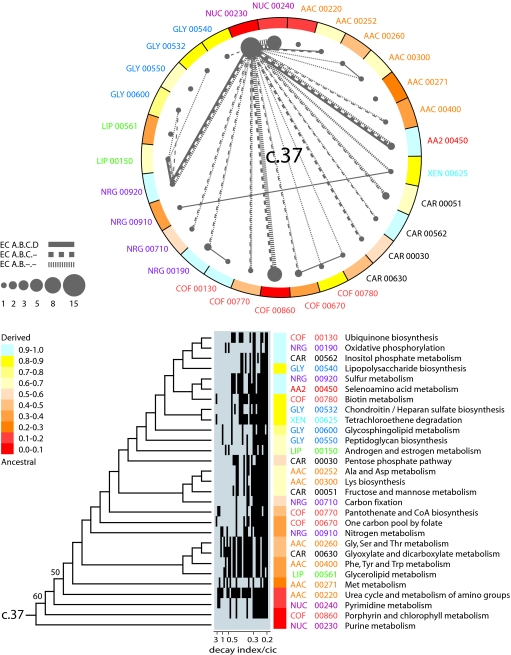
Metabolism represents a complex collection of enzymatic reactions and transport processes that convert metabolites into molecules capable of supporting cellular life. Here we explore the origins and evolution of modern metabolism. Using phylogenomic information linked to the structure of metabolic enzymes, we sort out recruitment processes and discover that most enzymatic activities were associated with the nine most ancient and widely distributed protein fold architectures. An analysis of newly discovered functions showed enzymatic diversification occurred early, during the onset of the modern protein world. Most importantly, phylogenetic reconstruction exercises and other evidence suggest strongly that metabolism originated in enzymes with the P-loop hydrolase fold in nucleotide metabolism, probably in pathways linked to the purine metabolic subnetwork. Consequently, the first enzymatic takeover of an ancient biochemistry or prebiotic chemistry was related to the synthesis of nucleotides for the RNA world.


Conflict of interest statement

The authors declare no conflict of interest.

Figures

Fig. 1.
Fig. 1.
Metabolism and the protein world. Reconstruction of a phylogenomic tree of protein fold architecture using data from a domain census in 185 fully sequenced genomes representing the three superkingdoms of life (15). One optimal most-parsimonious tree [85,644 steps; consistency index (CI) = 0.043; retention index (RI) = 0.770; length skewness (g1) = −0.136; permutation tail probability (PTP) test, P = 0.01] was recovered after a heuristic search with tree-bisection-reconnection branch swapping and 100 replicates of random addition sequence. Phylogenetically uninformative characters were excluded from the analysis. To decrease search times during branch swapping of suboptimal trees, no more than one tree was saved in each replicate. The tree depicted evolutionary relationships of 776 SCOP folds, was well resolved, had strong cladistic structure (P < 0.01), and was consistent with phylogenies generated from a set of 32 proteomes using a similar approach (13). Bullets identify 16 folds shared by the genomes analyzed (c.37, a.4, c.1, c.2, d.58. c.23, c.55, b.40, c.66, c.47, d.15, a.2, d.142, b.34, a.5, and c.120, from ancestral to derived; see SI Fig. 6 for fold names). All other terminal leaves are unlabeled because they would not be legible. A phylogenomic tree of the nine most ancient and widely shared folds identified in the global tree is described separately. An exhaustive maximum parsimony search resulted in one tree of 2,069 steps (CI = 0.687, RI = 0.728) that was well supported by bootstrap support (BS) values (shown below nodes) and decay indices (in parentheses) and measures of skewness in tree distribution (see Inset; PTP test, P = 0.01). Enzymatic activities associated with these nine ancestral folds were retrieved from MANET. These activities describe variability in reaction chemistry, indicating number of EC entries defined at the four different levels of classifications: class (A, one of six general enzyme categories), subclass (B, denoting type of chemical compound or group involved in the reaction), subsubclass (C, describing the type of reaction), and serial identifier (D, identification of individual enzymes). Discovered and rediscovered enzymatic activities are plotted in bar diagrams. The bar diagram above the universal tree shows range of distribution of folds unique to Archaea (A), Bacteria (B), and Eukarya (E) in the tree (red bars), those folds shared by prokaryotes (pink bar) and by other superkingdoms. The upper bound for organismal diversification is shown by coloring tree branches in red.
Fig. 2.
Fig. 2.
Discovery of enzymatic functions. The accumulation of newly discovered enzymatic activities along the phylogenomic tree of protein architecture was given as a function of distance in nodes from a hypothetical ancestral fold (nd) normalized to a 0–1 scale. The 9 and 24 most ancestral folds defined relative time frames (shaded area) in which newly discovered activities reached 80% and 100% of total EC entries analyzed at subclass (EC A.B) level, respectively. The dashed line delimits the upper bound for organismal diversification, at which time 100%, 100%, 98.2%, and 95.7% of enzymatic activities had been already discovered at first, second, third, and fourth levels of EC classification, respectively. Computational implementations are in SI Text.
Fig. 3.
Fig. 3.
Evolution of ancient subnetworks in mesonetworks. Two optimal most-parsimonious trees of 119 steps (CI = 0.580, RI = 0.587; g1 = −0.538; PTP test, P = 0.01) describing the origins of mesonetworks were recovered after a branch-and-bound search. The tree shown represents a strict consensus of the two trees. Branches with BS values >50% are shown above nodes. Vertical bars in the bar diagram describe the identity of terminal taxa joined by individual reduced cladistic consensus (RCC) support trees derived from double decay (DD) analysis. Within the seven RCC topologies, total decay ranged from 112 to 223 steps, and cladistic information content (cic) values ranged from 6.7 to 21.0. RCC topologies are presented in order, starting with the most informative (i.e., with higher decay-to-cic values), and support the phylogenetic statement.
Fig. 4.
Fig. 4.
A metabolic subnetwork wheel for the P-loop hydrolase fold. The graph shows subnetworks containing the c.37 fold as vertices, with numerical properties of vertices describing fold abundance and ancestries of the subnetworks and sharing of EC number at different levels of classification as edges, with line values describing sharing frequency. Node area is proportional to fold abundance, and line width is proportional to sharing of enzymatic activities. A single optimal most-parsimonious tree (208 steps; CI = 0.380, RI = 0.590; g1 = −0.495; PTP test, P = 0.01) describing the evolution of subnetworks harboring the c.37 fold (shown below the wheel) was recovered after a heuristic search with tree-bisection-reconnection branch swapping and 10 replicates of random addition sequence. Branches with BS values >50% are shown above nodes. Despite low BS values, RCC support trees derived from double decay (DD) analysis (described by rows in the bar diagram; see Fig. 3) showed that the topology of the tree was reliable. Within the 34 RCC topologies, total decay ranged from 5 to 27 steps and cladistic information content (cic) values ranged from 1.6 to 116.9. Subnetwork ancestries derived from the tree of subnetworks are given as a function of distance in nodes from a hypothetical ancestral subnetwork and are color coded and used to paint the wheel of subnetworks.

References

    1. Barabási AL, Oltvai ZN. Nat Rev Genet. 2004;5:101–113. - PubMed
    1. Schmidt S, Sunyaev S, Bork P, Dandekar T. Trends Biochem Sci. 2003;28:336–341. - PubMed
    1. Ycas M. J Theor Biol. 1974;44:145–160. - PubMed
    1. Jensen RA. Annu Rev Microbiol. 1976;30:409–425. - PubMed
    1. Copley RR, Bork P. J Mol Biol. 2000;303:627–640. - PubMed

Publication types