. 2007 May 29;104(22):9499-504.
doi: 10.1073/pnas.0701104104. Epub 2007 May 21.

Rapid enhancement of visual cortical response discriminability by microstimulation of the frontal eye field

Affiliations

Rapid enhancement of visual cortical response discriminability by microstimulation of the frontal eye field

Katherine M Armstrong et al. Proc Natl Acad Sci U S A. .

Abstract

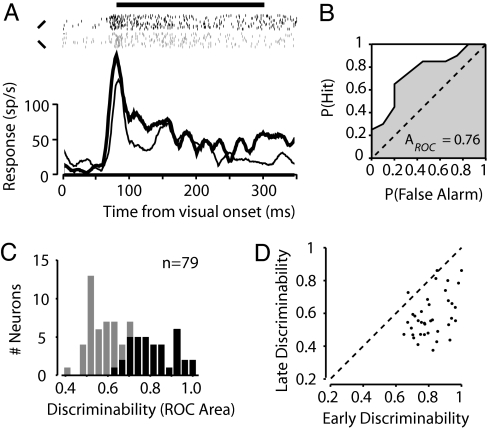
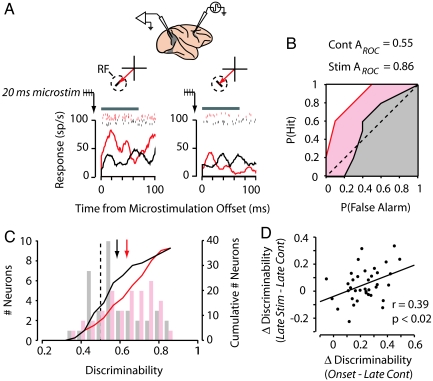
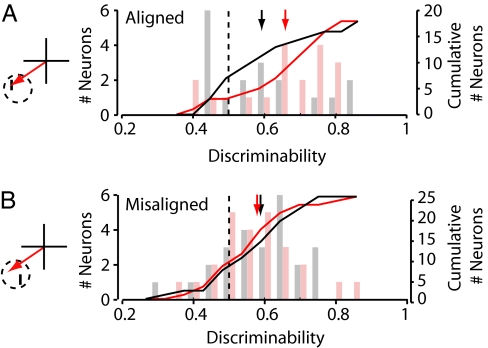
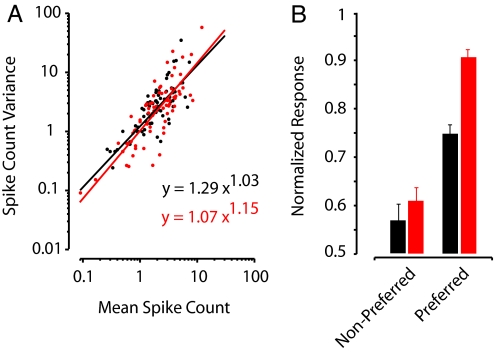
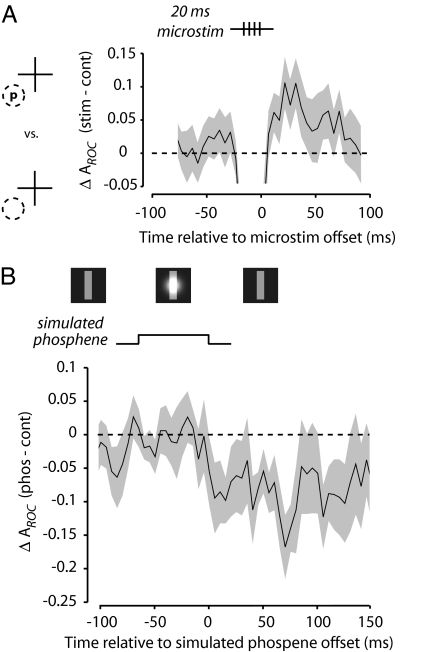
Visual attention provides a means of selecting among the barrage of information reaching the retina and of enhancing the perceptual discriminability of relevant stimuli. Neurophysiological studies in monkeys and functional imaging studies in humans have demonstrated neural correlates of these perceptual improvements in visual cortex during attention. Importantly, voluntary attention improves the discriminability of visual cortical responses to relevant stimuli. Recent work aimed at identifying sources of attentional modulation has implicated the frontal eye field (FEF) in driving spatial attention. Subthreshold microstimulation of the FEF enhances the responses of area V4 neurons to spatially corresponding stimuli. However, it is not known whether these enhancements include improved visual-response discriminability, a hallmark of voluntary attention. We used receiver-operator characteristic analysis to quantify how well V4 responses discriminated visual stimuli and examined how discriminability was affected by FEF microstimulation. Discriminability of responses to stable visual stimuli decayed over time but was transiently restored after microstimulation of the FEF. As observed during voluntary attention, the enhancement resulted only from changes in the magnitude of V4 responses and not in the relationship between response magnitude and variance. Enhanced response discriminability was apparent immediately after microstimulation and was reliable within 40 ms of microstimulation onset, indicating a direct influence of FEF stimulation on visual representations. These results contribute to the mounting evidence that saccade-related signals are a source of spatial attentive selection.


Conflict of interest statement

The authors declare no conflict of interest.

Figures

Fig. 1.
Fig. 1.
Visual-response discriminability of V4 neurons. (A) Histograms show the average response of an example V4 neuron to the onset of a 45° (thick line) or 135° (thin line) bar presented inside its RF. Rasters (black and gray for 45° and 135° bars, respectively) show action potentials recorded on individual trials. The horizontal line above the rasters indicates the analysis window used to characterize the onset response. (B) ROC curve computed from the onset responses to the two stimuli. The area underneath the curve yields a measurement of how well the V4 neuron's response discriminates between the 45° and 135° bars. This neuron's response reliably discriminated the two stimuli, yielding an ROC area of 0.76. (C) Discriminability values (ROC areas) computed for the population of V4 neurons. Black shading indicates neurons with significant stimulus tuning during the onset analysis window. (D) Comparison of discriminability values computed during early (90 ms after visual onset) versus late (> 500 ms after stimulus onset) analysis windows. The late discriminability values shown here were computed from responses during control trials only.
Fig. 2.
Fig. 2.
Subthreshold FEF microstimulation enhances V4 response discriminability. (A) Twenty-millisecond trains of microstimulation were applied to the FEF while visual responses were recorded in an example V4 neuron. FEF and V4 electrodes were positioned so that the saccade that could be evoked at the microstimulation site (red arrow) moved the monkey's gaze to the RF (dotted circle) of the V4 neuron. Histograms and rasters show the response of the V4 neuron to a 45° (Left) and 135° (Right) oriented-bar stimulus for stimulation (red) and control (black) trials (10 repetitions). Histograms and rasters are aligned to the offset of the 20-ms train of subthreshold FEF microstimulation, which was applied 500 ms after visual onset, and to the corresponding period during control trials. The gray bar above the rasters indicates the 70-ms analysis window used to study the effect of microstimulation on neuronal responses. (B) ROC curves computed for the neuron shown in A during the late-analysis window for stimulation (red) and control (black) trials. (C) Discriminability for stimulation (red) and control (black) conditions for the population of stimulus-selective V4 neurons studied. Bar graphs show the distribution of ROC areas (Left ordinate), and colored lines show the corresponding cumulative distribution functions (Right ordinate). Arrows indicate mean ROC area. (D) The effect of subthreshold FEF microstimulation on response discriminability was correlated with the change in discriminability that occurred between the visual-onset and the late-trial analysis periods. Dots show discriminability values for individual neurons, and the line shows the linear best fit.
Fig. 3.
Fig. 3.
Effect of subthreshold FEF microstimulation on response discriminability for aligned and misaligned visual stimulus conditions. (A) (Left) During aligned stimulus conditions, the visual stimulus was positioned within the RF (dotted circle) at the end point of the saccade that could be evoked from the stimulation site (red arrow). (Right) Late-period discriminability is shown for stimulation (red) and control (black) conditions for the population of neurons exhibiting reliable tuning for aligned stimuli. Conventions are as described in Fig. 2C. (B) (Left) During misaligned stimulus conditions, the visual stimulus was positioned within the RF (dotted circle) at a location that was spatially offset from the end point of the saccade that could be evoked from the stimulation site (red arrow). (Right) Late-period discriminability values for stimulation (red) and control (black) conditions for the population of neurons exhibiting reliable tuning for misaligned stimuli. Conventions are as described in Fig. 2C.
Fig. 4.
Fig. 4.
Effect of subthreshold FEF microstimulation on response magnitude and reliability. (A) Relationship between response variance (computed across trials) and average response (spike count) during the late-analysis window for stimulation (red) and control (black) trials. Individual dots show the values for each tuned neuron's response to preferred and nonpreferred stimuli. Power functions were fit to the data for stimulation (red line) and control (black line) conditions. Best-fit equations are shown. (B) Normalized population responses during the late-analysis window for stimulation (red) and control (black) trials. Error bars indicate the SEM.
Fig. 5.
Fig. 5.
Timing of stimulation-driven effects on discriminability and comparison with the effect of a simulated phosphene. (A) A subset of neurons was tested with 20-ms trains of microstimulation (four current pulses at 200 Hz). The average difference in response discriminability (ΔAROC, stimulation minus control) of preferred (p) and blank (background) stimuli in the RF (dotted circle) is shown around the time of FEF microstimulation. Shading indicates SEM. The decrease in discriminability seen during microstimulation is caused by the stimulation artifact. (B) The effect of a simulated phosphene (Gaussian brightness patch superimposed on a RF stimulus; Upper) on response discriminability of preferred and blank stimuli was examined in a population of V4 neurons (n = 11). The difference in ROC area (phosphene minus control) is shown around the time of the simulated phosphene presentation. Shading indicates SEM.

References

    1. Posner MI. Q J Exp Psychol. 1980;32:3–25. - PubMed
    1. Cameron EL, Tai JC, Carrasco M. Vision Res. 2002;42:949–967. - PubMed
    1. Carrasco M, Williams PE, Yeshurun Y. J Vis. 2002;2:467–479. - PubMed
    1. Lee DK, Koch C, Braun J. Vision Res. 1997;37:2409–2418. - PubMed
    1. Moran J, Desimone R. Science. 1985;229:782–784. - PubMed

Publication types