. 2007 May 29;104(22):9242-7.
doi: 10.1073/pnas.0703587104. Epub 2007 May 21.

Development of autoimmunity in mice lacking DNA topoisomerase 3beta

Affiliations

Development of autoimmunity in mice lacking DNA topoisomerase 3beta

Kelvin Y Kwan et al. Proc Natl Acad Sci U S A. .

Abstract

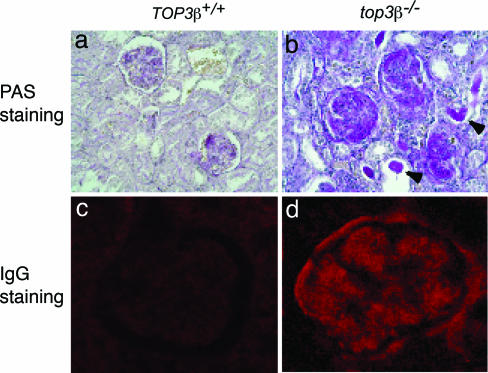
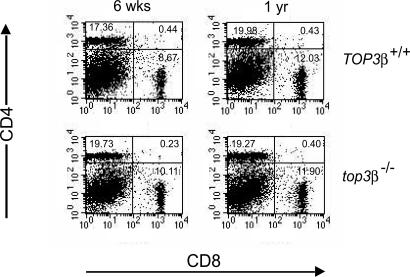
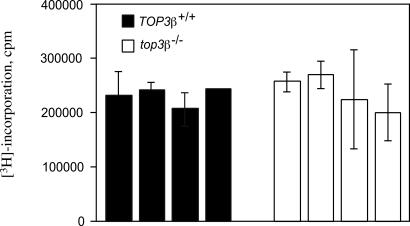
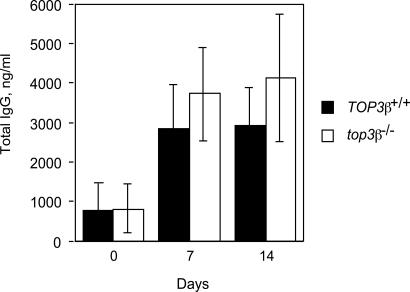
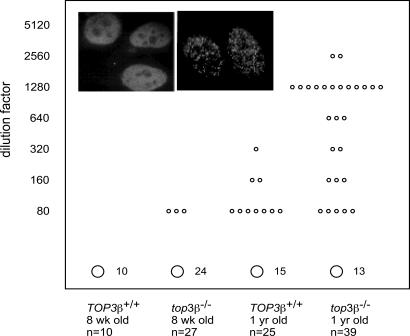
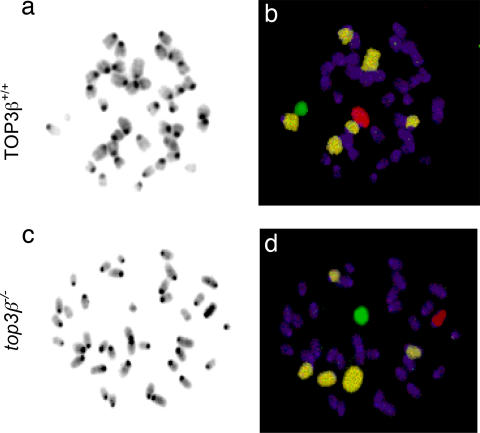
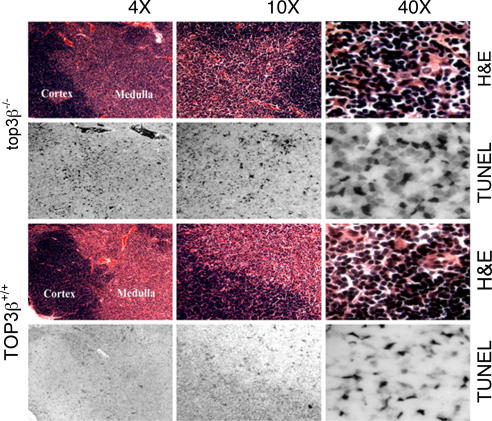
Mice lacking DNA topoisomerase 3beta are predisposed to a shortened lifespan, infertility, and lesions in multiple organs resulting from inflammatory responses. Examination of the immune system of 6- and 52-week-old top3beta(-/-) mice revealed no significant aberrations in their central and peripheral tolerance or in T lymphocyte activation. However, the older but not the younger cohort shows a high incidence of serum autoantibodies relative to their TOP3beta(+/+) age-mates. The mutant mice also show an increase in numerical aberrations of chromosomes in splenocytes and bone marrow cells, as well as an increase in apoptotic cells in the thymus. Thus, it appears plausible that the inflammatory lesions in top3beta(-/-) mice are caused by the development of autoimmunity as they age: Chromosomal abnormalities in top3beta(-/-) mice might lead to a persistent increase in apoptotic cells, which might in turn lead to the progression of autoimmunity.


Conflict of interest statement

The authors declare no conflict of interest.

Figures

Fig. 1.
Fig. 1.
Immunocomplexes in the glomeruli of top3β−/− mice. (a and b) Periodic acid/Schiff (PAS) and hematoxylin staining of kidney sections at ×400 magnification in TOP3β+/+ and top3β−/− animals reveals significant amounts of magenta-colored protein deposits in the latter (b), but not the former (a). Proteinaceous infiltrates, two of which are marked by arrowheads in b, are often observed in the renal tubules of the mutant animals. (c and d) Two higher magnification (×1,000) photomicrographs of kidney sections stained with fluorescence-labeled rabbit anti-mouse IgG antibodies. Background and intense fluorescence were seen, respectively, in a glomerulus of TOP3β+/+ (c) and top3β−/− (d) mice.
Fig. 2.
Fig. 2.
Unchanged proportion of CD4+ and CD8+ T cells in top3β−/− mice. Splenocytes of groups of TOP3β+/+ and top3β−/− mice 6 weeks and 1 year of age were first treated with FITC-tagged antibodies against CD4 and PE-tagged antibodies against CD8, and then analyzed by flow cytometry. For each group, data from sorting of cells from three mice were combined and displayed. The calculated percentage of each cell population is shown in the corresponding quadrant of the figure. All mice in this experiment exhibited no apparent sign of disease.
Fig. 3.
Fig. 3.
An example of T cell proliferation on stimulation with anti-CD3 antibodies. In this experiment, four 6-week-old TOP3β+/+ mice and the same number of their top3β−/− age-mates were used. Growth of T cells purified from the spleens of individual animals was stimulated by the addition of anti-CD3 antibodies to a final concentration of 0.1 μg/ml, and [3H]thymidine was added 48 h later to pulse-label replicating DNA. Data represent the average of triplicate cell samples from each of the four individual TOP3β+/+ and top3β−/− mice, and error bars represent standard deviations of the samples.
Fig. 4.
Fig. 4.
Total Ig level in sera of TOP3β+/+ and top3β−/− mice collected 0, 7, or 14 days after immunization. Individual mice were immunized with TNP-conjugated KLH on day 0. Each bar represents the average value from three individual TOP3β+/+ (filled bars) or three top3β−/− (empty bars) mice; error bars represent standard deviations of the samples.
Fig. 5.
Fig. 5.
Autoantibody levels in sera of TOP3β+/+ and top3β−/− mice. Blood samples were collected from four groups of mice with no overt sign of disease: 8-week-old TOP3β+/+, 8-week-old top3β−/−, 1-year-old TOP3β+/+, and 1-year-old top3β−/−, with the total number (n) of animals in each group specified under each datum column. 2-fold serial dilutions of sera were incubated with HEp-2 cells, and autoantibodies bound to the indicator cells were visualized at a magnification of ×1,000 in a fluorescence microscope by the binding of fluorochrome-conjugated anti-mouse Fcγ antibodies. The signal from undiluted sera from the 8-week-old TOP3β+/+ group was taken as the background level, and the maximal dilution, in the range from 80 to 5,120, which gave a visual indication of a higher level of autoantibodies, was recorded for each serum and marked as a small circle in the figure. The total number of serum samples of each group that showed background levels of autoantibodies is specified next to a large circle at the bottom of each column. (Insets) Two distinct patterns of staining of HEp-2 cell nuclei by autoantibodies in the sera tested: A diffuse signal (Left Inset) or a speckled pattern (Right Inset). Fluorescence-labeled rabbit antibodies against murine IgG were used in this experiment.
Fig. 6.
Fig. 6.
Aberrations in chromosome numbers in somatic top3β−/− cells. Two sets of bone marrow cell metaphases, one from a TOP3β+/+ and the other from a top3β−/− animal, are illustrated. Metaphase spreads were hybridized with a mixture of fluorescence-labeled probes to mark the autosomes 1, 3, and 16 in one color and the sex chromosomes in different colors; all chromosomes were further stained with DAPI before viewing in a fluorescence microscope. (a and c) The DAPI-stained chromosomes were more easily visualized as black-and-white images. In the examples shown, the TOP3β+/+ cell contained the full complement of 20 pairs of chromosomes, but one of the painted autosomes is missing in the top3β−/− bone marrow cell. (b and d) Separate fluorescent images of each set were merged to show the Cy5-labeled autosomes 1, 3, and 16 in pale yellow; the Cy3-labeled X chromosome in red; the FITC-labeled Y chromosome in green; and all of the other chromosomes in purple.
Fig. 7.
Fig. 7.
Increased apoptotic cells in the thymus of top3β−/− compared to TOP3β+/+ mice. Presence of apoptotic cells was detected by TUNEL staining. H&E stains of parallel sections are shown for both TOP3β+/+ and top3β−/− thymi, with the darker staining thymic cortex and lighter medulla indicated.

References

    1. Wang JC. Annu Rev Biochem. 1996;65:635–692. - PubMed
    1. Wang JC. Nat Rev Mol Cell Biol. 2002;3:430–440. - PubMed
    1. Champoux JJ. Annu Rev Biochem. 2001;70:369–413. - PubMed
    1. Dekker NH, Rybenkov VV, Duguet M, Crisona NJ, Cozzarelli NR, Bensimon D, Croquette V. Proc Natl Acad Sci USA. 2002;99:12126–12131. - PMC - PubMed
    1. Lima CD, Wang JC, Mondragon A. Nature. 1994;367:138–146. - PubMed

Publication types

LinkOut - more resources