Comparative Study
. 2007 Jun 5;104(23):9627-32.
doi: 10.1073/pnas.0611560104. Epub 2007 May 21.

Primary protein response after ligand photodissociation in carbonmonoxy myoglobin

Affiliations
Comparative Study

Primary protein response after ligand photodissociation in carbonmonoxy myoglobin

Akira Sato et al. Proc Natl Acad Sci U S A. .

Abstract

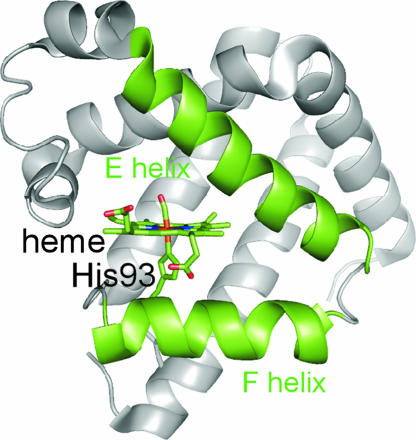
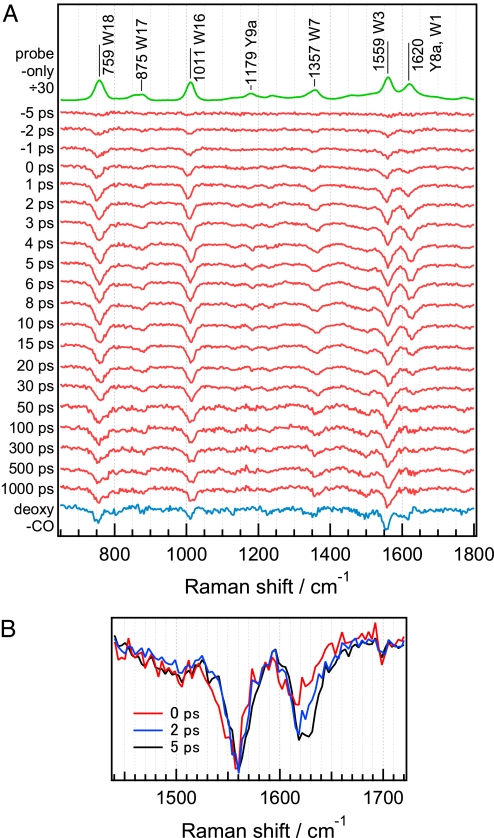
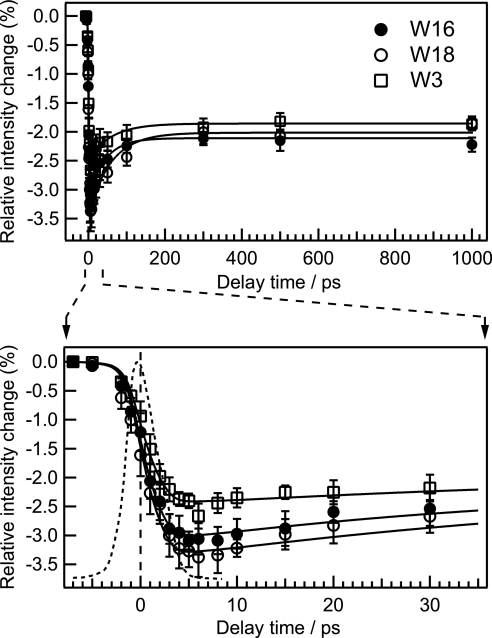
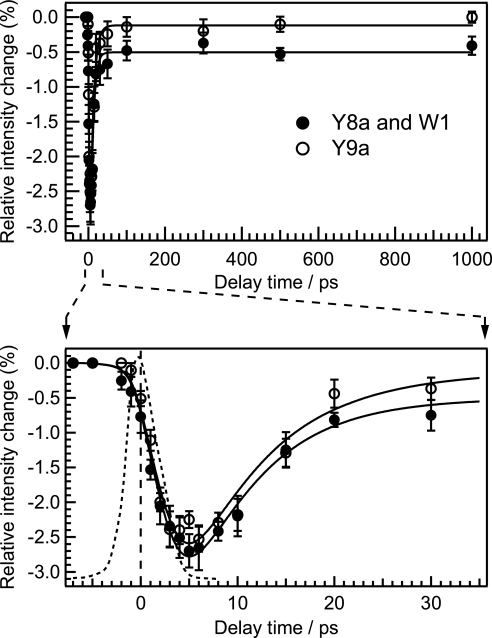
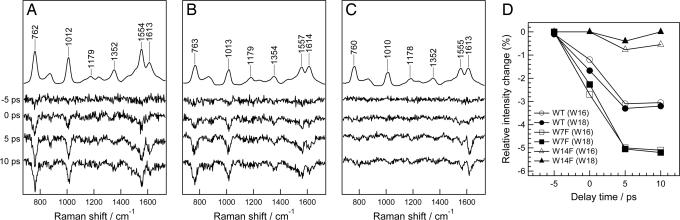
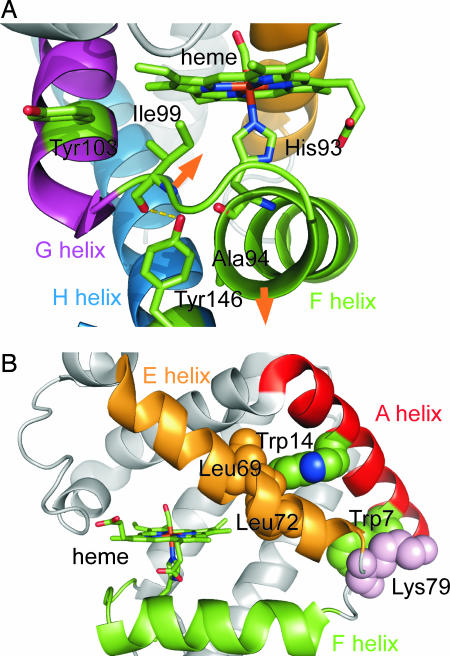
Time-resolved UV resonance Raman (UVRR) spectroscopic studies of WT and mutant myoglobin were performed to reveal the dynamics of protein motion after ligand dissociation. After dissociation of carbon monoxide (CO) from the heme, UVRR bands of Tyr showed a decrease in intensity with a time constant of 2 ps. The intensity decrease was followed by intensity recovery with a time constant of 8 ps. On the other hand, UVRR bands of Trp residues located in the A helix showed an intensity decrease that was completed within the instrument response time. The intensity decrease was followed by an intensity recovery with a time constant of approximately 50 ps and lasted up to 1 ns. The time-resolved UVRR study of the myoglobin mutants demonstrated that the hydrophobicity of environments around Trp-14 decreased, whereas that around Trp-7 barely changed in the primary protein response. The present data indicate that displacement of the E helix toward the heme occurs within the instrument response time and that movement of the FG corner takes place with a time constant of 2 ps. The finding that the instantaneous motion of the E helix strongly suggests a mechanism in which protein structural changes are propagated from the heme to the A helix through the E helix motion.


Conflict of interest statement

The authors declare no conflict of interest.

Figures

Fig. 1.
Fig. 1.
Diagram showing the arrangement of the E and F helices that hold the heme group. This figure was produced with PyMOL (http://pymol.sourceforge.net) by using a structure from the Protein Data Bank (PDB ID code 1DWR).
Fig. 2.
Fig. 2.
Picosecond UVRR difference spectra of the photodissociated WT horse skeletal MbCO. (A) The difference spectra in the range of 650–1,800 cm−1. The top trace is a probe-only spectrum corresponding to the UVRR spectrum of MbCO divided by a factor of 30. The bottom trace is a deoxyMb-minus-MbCO difference spectrum. Spectra have been offset for clarity. (B) The overlaid difference spectra at early time delays showing slower intensity decrease of the 1,620-cm−1 band relative to that of W3 band. The spectrum for each time delay is normalized in terms of intensity of the W3 negative band.
Fig. 3.
Fig. 3.
Temporal changes of integrated intensity of W18, W16, and W3 bands relative to the integrated intensity in the probe-only spectrum. The solid lines are fits using an exponential function of the form A[1 + B exp(−trise)] convoluted with an instrument response function (dashed line). The fit line for each band was obtained with the parameters of τrise = 49 ± 16 ps and B = 0.62 ± 0.06 for W18, τrise = 45 ± 15 ps and B = 0.48 ± 0.05 for W16, and τrise = 59 ± 18 ps and B = 0.34 ± 0.03 for W3, respectively. The lower panel shows a close-up of the curve in the early time region of the upper panel.
Fig. 4.
Fig. 4.
Temporal changes of integrated intensity of the 1620-cm−1 and Y9a bands relative to the intensity in the probe-only spectrum. It should be noted that the intensity change of the band at 1620 cm−1 mainly arises from intensity change of Y8a band with a smaller contribution from intensity change of W1 band. The solid lines are fits using a sum of two exponential functions of the form A[1 − exp(−tdecay)] + B[exp(−trise) − 1] convoluted with the instrument response function (dashed line). The fit line for the 1,620-cm−1 band was obtained with the parameters of τdecay = 1.9 ± 0.9 ps, τrise = 7.3 ± 1.4 ps, A = 0.21 ± 0.03, and B = 0.19 ± 0.03. The fit line for the Y9a band was obtained with the parameters of τdecay = 2.0 ± 0.8 ps, τrise = 8.0 ± 3.6 ps, A = 0.19 ± 0.03, and B = 0.18 ± 0.03. The lower panel shows a close-up of the curve in the early time region of the upper panel.
Fig. 5.
Fig. 5.
Comparison of intensity change of Trp Raman bands in WT Mb and in Trp mutants of Mb. (AC) Time-resolved difference spectra of WT Mb, W7F-Mb and W14F-Mb, respectively. The top trace in each panel is the UVRR spectrum of MbCO. Spectra in each panel have been offset for clarity. (D) The changes of integrated intensity of W18 and W16 bands in WT and the two mutant Mbs relative to the intensity in the individual probe-only spectra against a delay time.
Fig. 6.
Fig. 6.
Crystallographic structure of horse Mb (22). (A) Close-up of the region near the two Tyr residues. (B) Close-up of the region near the two Trp residues. The orange arrows indicate the directions of motions of the F helix and FG corner after CO dissociation that are expected from crystallographic studies. This figure was produced with PyMOL (http://pymol.sourceforge.net) by using a structure from the Protein Data Bank (PDB ID code 1DWR).

References

    1. Perutz MF, Fermi G, Luisi B, Shaanan B, Liddington RC. Acc Chem Res. 1987;20:309–321. - PubMed
    1. Dickerson RE, Geiss I. Hemoglobin: Structure, Function, Evolution, and Pathology. Menlo Park, CA: Benjamin Cummings; 1983.
    1. Jain R, Chan MK. J Biol Inorg Chem. 2003;8:1–11. - PubMed
    1. Kachalova GS, Popov AN, Bartunik HD. Science. 1999;284:473–476. - PubMed
    1. Goodno GD, Astinov V, Miller RJD. J Phys Chem A. 1999;103:10630–10643.

Publication types

LinkOut - more resources