

Disruptive mitochondrial DNA mutations in complex I subunits are markers of oncocytic phenotype in thyroid tumors
- PMID: 17517629
- PMCID: PMC1885617
- DOI: 10.1073/pnas.0703056104
Disruptive mitochondrial DNA mutations in complex I subunits are markers of oncocytic phenotype in thyroid tumors
Abstract
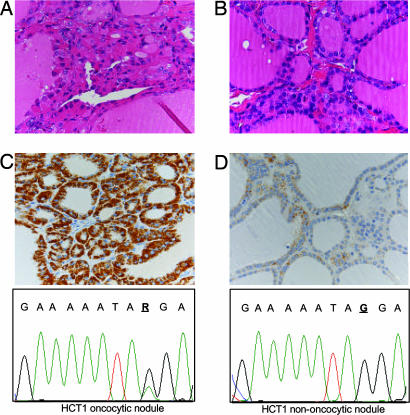
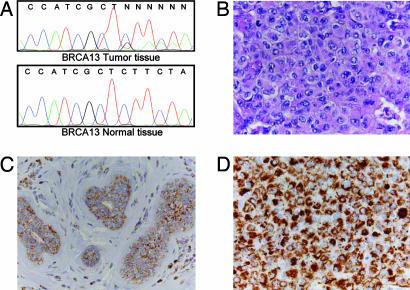
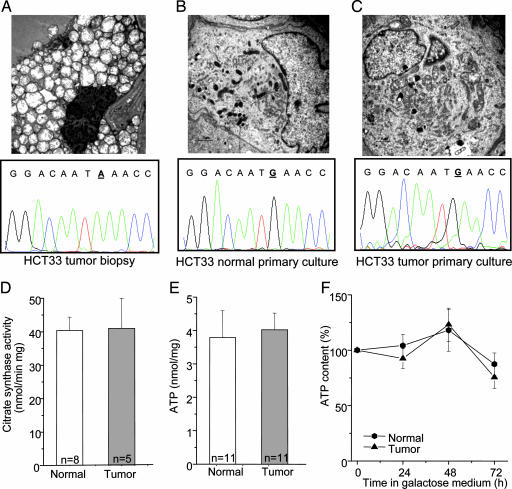
Oncocytic tumors are a distinctive class of proliferative lesions composed of cells with a striking degree of mitochondrial hyperplasia that are particularly frequent in the thyroid gland. To understand whether specific mitochondrial DNA (mtDNA) mutations are associated with the accumulation of mitochondria, we sequenced the entire mtDNA in 50 oncocytic lesions (45 thyroid tumors of epithelial cell derivation and 5 mitochondrion-rich breast tumors) and 52 control cases (21 nononcocytic thyroid tumors, 15 breast carcinomas, and 16 gliomas) by using recently developed technology that allows specific and reliable amplification of the whole mtDNA with quick mutation scanning. Thirteen oncocytic lesions (26%) presented disruptive mutations (nonsense or frameshift), whereas only two samples (3.8%) presented such mutations in the nononcocytic control group. In one case with multiple thyroid nodules analyzed separately, a disruptive mutation was found in the only nodule with oncocytic features. In one of the five mitochondrion-rich breast tumors, a disruptive mutation was identified. All disruptive mutations were found in complex I subunit genes, and the association between these mutations and the oncocytic phenotype was statistically significant (P=0.001). To study the pathogenicity of these mitochondrial mutations, primary cultures from oncocytic tumors and corresponding normal tissues were established. Electron microscopy and biochemical and molecular analyses showed that primary cultures derived from tumors bearing disruptive mutations failed to maintain the mutations and the oncocytic phenotype. We conclude that disruptive mutations in complex I subunits are markers of thyroid oncocytic tumors.
Conflict of interest statement
The authors declare no conflict of interest.
Figures
Comment in
-
How humans stand out in frontal lobe scaling.Proc Natl Acad Sci U S A. 2013 Sep 24;110(39):E3682. doi: 10.1073/pnas.1308850110. Epub 2013 Sep 12. Proc Natl Acad Sci U S A. 2013. PMID: 24029020 Free PMC article. No abstract available.
References
-
- Penta J-S, Johnson F-M, Wachsman J-T, Copeland W-C. Mut Res. 2001;488:119–133. - PubMed
-
- Lievre A, Chapusot C, Bouvier A-M, Zinzindohoue F, Piard F, Roignot P, Arnould L, Beaune P, Faivre J, Laurent-Puig P. J Clin Oncol. 2005;23:3517–3525. - PubMed
-
- Parrella P, Xiao Y, Fliss M, Sanchez-Cespedes M, Mazzarelli P, Rinaldi M, Nicol T, Gabrielson E, Cuomo C, Cohen D, et al. Cancer Res. 2001;61:7623–7626. - PubMed
Publication types
MeSH terms
Substances
LinkOut - more resources
Full Text Sources
Other Literature Sources
Medical
