. 2007 May 22;104(21):8995-9000.
doi: 10.1073/pnas.0700631104. Epub 2007 May 15.

Chromosome instability, chromosome transcriptome, and clonal evolution of tumor cell populations

Affiliations

Chromosome instability, chromosome transcriptome, and clonal evolution of tumor cell populations

ChongFeng Gao et al. Proc Natl Acad Sci U S A. .

Abstract

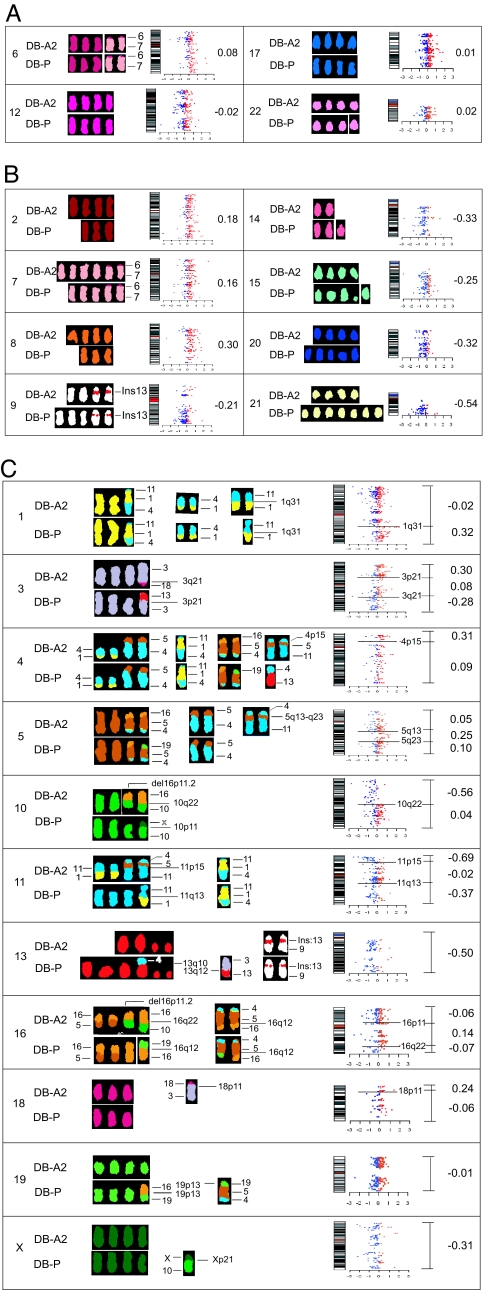
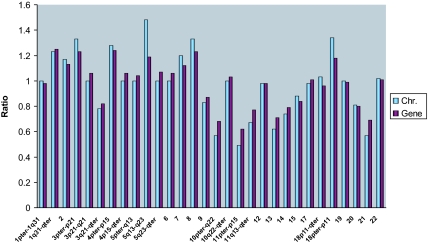
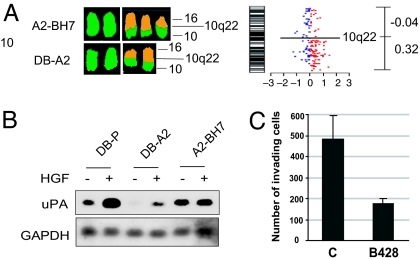
Chromosome instability and aneuploidy are hallmarks of cancer, but it is not clear how changes in the chromosomal content of a cell contribute to the malignant phenotype. Previously we have shown that we can readily isolate highly proliferative tumor cells and their revertants from highly invasive tumor cell populations, indicating how phenotypic shifting can contribute to malignant progression. Here we show that chromosome instability and changes in chromosome content occur with phenotypic switching. Further, we show that changes in the copy number of each chromosome quantitatively impose a proportional change in the chromosome transcriptome ratio. This correlation also applies to subchromosomal regions of derivative chromosomes. Importantly, we show that the changes in chromosome content and the transcriptome favor the expression of a large number of genes appropriate for the specific tumor phenotype. We conclude that chromosome instability generates the necessary chromosome diversity in the tumor cell populations and, therefore, the transcriptome diversity to allow for environment-facilitated clonal expansion and clonal evolution of tumor cell populations.


Conflict of interest statement

The authors declare no conflict of interest.

Figures

Fig. 1.
Fig. 1.
Comparisons of chromosome copy number and the chromosome transcriptome for DB-A2 and DB-P. Representative chromosomes (indicated by the numeral at the left) from DB-A2 and DB-P cells were aligned to compare the relative gain or loss of chromosome copies. Expression data for genes that map to each chromosome are displayed as scatter plots. Blue dots represent down-regulated genes and red dots represent up-regulated genes. The change in the transcriptome for each chromosome is in log2 units and is shown by the number to the right of each scatter plot. (A) Chromosomes without copy number changes. (B) Chromosomes with full copy gains or losses. (C) Chromosomes with derivative regions. Each scatter plot was subdivided according to gain or loss of the subchromosomal regions. The chromosome transcriptome ratio for each region is indicated by the mean values (in log2 units) to the right of the scatter plot. A correlation is observed between each derivative subchromosomal region and the chromosome transcriptome profile.
Fig. 2.
Fig. 2.
Comparing chromosomal copy number ratio to the chromosome transcriptome ratio. The copy numbers of each chromosome in DB-P and DB-A2 were determined by SKY and FISH and are presented in Tables 1 and 2. The ratios of chromosome numbers for DB-A2 versus DB-P were determined by comparing the total number of chromosome or subchromosomal region in 10 metaphases. The chromosome transcriptome ratios were obtained by averaging the expression of all available genes on each chromosome or subchromosome region, and values determined in log2 units were converted to numerical ratios.
Fig. 3.
Fig. 3.
Chromosome change-associated up-regulation of uPA contributes to the invasive phenotype of A2-BH7. (A) Changes in A2-BH7 versus DB-A2 cells in chromosome number and chromosome transcriptome. (B) Northern blot analysis showing up-regulation of uPA in BH7 cells. (C) The uPA inhibitor, B428, blocked HGF-induced cell invasion through Matrigel. Cells (10,000 per insert) were loaded into Matrigel inserts and treated with 10 μM B428 or left untreated (controls, C) for 1 h before adding HGF/SF.

References

    1. Nowell PC. Science. 1976;194:23–28. - PubMed
    1. Chambers AF, Groom AC, MacDonald IC. Nat Rev Cancer. 2002;2:563–572. - PubMed
    1. Rajagopalan H, Lengauer C. Nature. 2004;432:338–341. - PubMed
    1. Barrett MT, Sanchez CA, Prevo LJ, Wong DJ, Galipeau PC, Paulson TG, Rabinovitch PS, Reid BJ. Nat Genet. 1999;22:106–109. - PMC - PubMed
    1. Duesberg P. Science. 2005;307:41. - PubMed

Publication types

Substances

LinkOut - more resources